Stacking Is Regional - How Concrete Supply Chains get to Zero
Why decarbonizing concrete requires hyper-local analysis — and what the Los Angeles market teaches us about building a regional stacking roadmap.
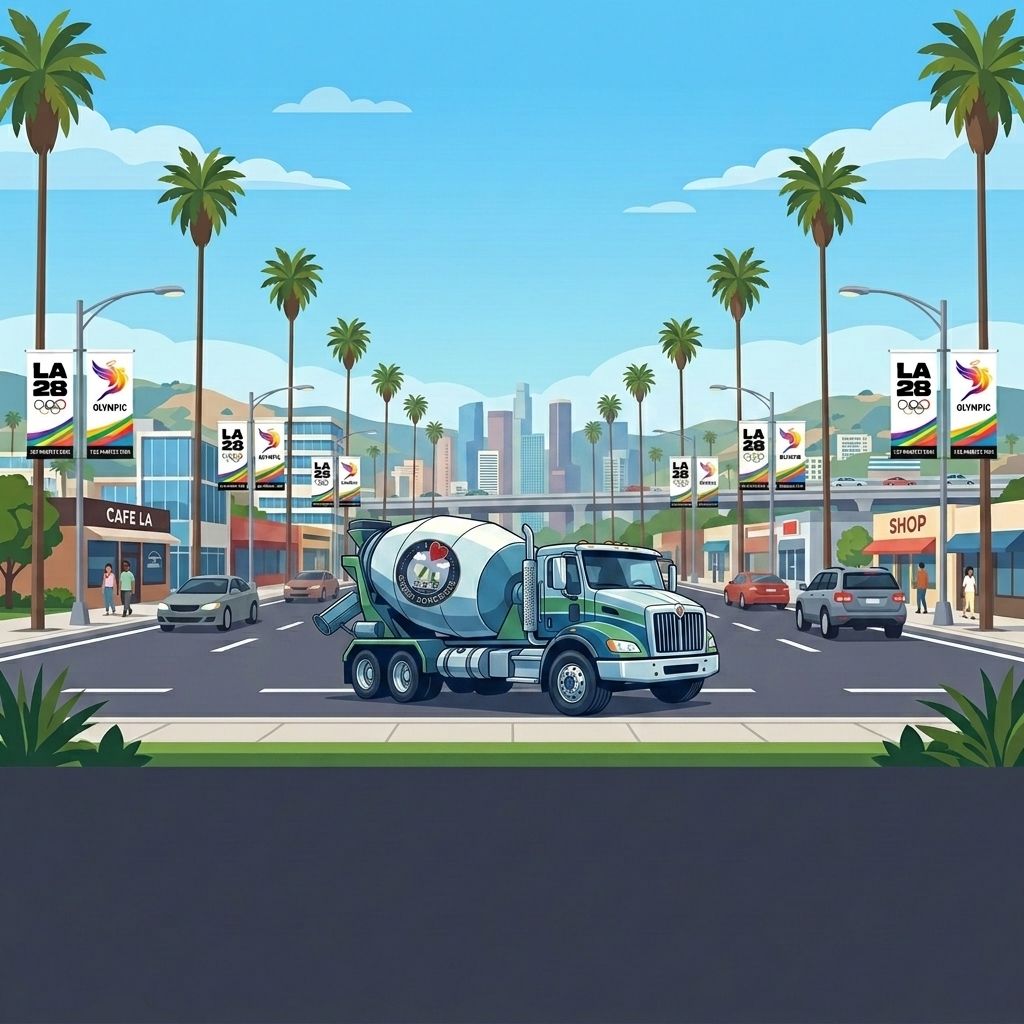
Los Angeles — ground zero for demonstrating that concrete decarbonization is a regional challenge.
Executive Summary
In our Concrete Ideas: Carbon, we established that stacking multiple decarbonization levers is required to reach net-zero concrete. But stacking is not a universal formula — it must be adapted to regional realities.
Every region has different ‘base’ production assets, building codes, construction types, climates, soils, aggregate quality, and feedstock availability. These physical constraints dictate which decarbonization levers are viable locally and cost-effectively.
The Los Angeles MSA provides a powerful case study: ~5 million tons of cement consumed annually across 15–20 million cubic yards of demand, constrained by poor local aggregates that force higher cement factors.
Using a BOxCrete-informed framework, we calculate that to achieve optimized low carbon mix designs across all strength and placement applications, LA would need ~2.75 million additional tons of SCM supply per year AND must also decarbonize a minimum of ~1.5 million tons of existing OPC production.
Stacking from a Single Truck to Regional Supply Chains
In Carbon: The Reason We Are Here, we established that no single technology will decarbonize concrete alone. The industry must stack multiple levers — SCMs, novel binders, carbon mineralization into SCMs and aggregates, carbon-cured additives, and CCS-produced cement — all layered together in the same ready-mix truck to reach 90%+ reduction. We introduced the "Ready Mix Truck Test" as the strategic filter: does a subject solution play well with others?
The ‘Ready Mix Truck Test’ addresses stacking at the product level — what goes into a single cubic yard of concrete. We now take on the harder question: how do you stack at the regional level? Or put another way: What combination of decarbonized cementitious production & distribution sites do I need to collectively deliver a fully decarbonized supply chain across all concrete needs in my region?
The ingredients available for stacking are not the same everywhere. They are dictated by geology, logistics, policy, and the physical infrastructure of a specific supply basin. They are also produced at different volumes and costs.
To answer that question, we need data. At CTC, we collect and synthesize supply chain intelligence across the national concrete ecosystem and publish some of it through the Concrete Atlas — our platform for mapping cement plants, ready-mix facilities, SCM availability, and regional emissions profiles.
Why Stacking Is Regional: The Case of Los Angeles
Concrete is a hyper-local commodity. It is heavy, cheap, and perishable — a ready-mix truck must deliver within 90 minutes of batching. While some individual feedstocks like cement or slag are sometimes shipped, every region's concrete is fundamentally shaped by what is physically available within a short radius. And those inputs vary enormously and have knock on effects on logistics, regulation, & cost.
A Regional Stacking Roadmap
Step I: What are the Local Conditions
Any region’s decarbonization strategy must adapt to what is physically available within a 50-mile radius. What follows is an application of that data to illustrate regional stacking in one specific market: Los Angeles.
Building Codes
California seismic codes demand different concrete than Midwest wind-load codes or Florida hurricane standards.
Construction Types
LA pours pools and retaining walls. Houston pours tilt-wall warehouses. NYC pours high-rise cores. Each demands different mixes.
Climate
Freeze-thaw in Minnesota requires air entrainment. Sulfate exposure in coastal Florida requires different cement chemistry entirely.
Soils & Geology
Expansive clays in Texas, liquefiable fill in the Bay Area, and karst terrain in the Southeast each dictate foundation concrete specs.
Aggregate Quality
Glacial aggregates in the Great Lakes are excellent. Desert alluvial deposits in Southern California are sub-optimal — forcing higher cement content.
Feedstock Availability
Slag near steel mills in Indiana. Fly ash near coal plants in the Midwest. Zero legacy industrial byproducts in the LA basin.
Step II: What do we Build in the Region?
We’ve started with the local conditions influencing the cement & concrete market. Now, to build a responsive decarbonization plan, we must first understand what the region actually builds. Southern California is one of the largest concrete markets in the country — consuming an estimated 15 to 20 million cubic yards of concrete and approximately 5 million tons of cement every year.
15–20M
Cubic Yards / Year
One of the largest concrete markets in the country by annual volume
~13,000
Swimming Pools / Year
Southern California builds more gunite and shotcrete pools than anywhere on Earth — each one is ~40 CY of concrete
250+
Miles of New Sidewalks
City infrastructure alone pours hundreds of miles of flatwork annually
Zone 4
Seismic Design Category
The highest seismic classification drives higher-strength concrete specs across all structural applications
1M tons
LA28 Low-Carbon Goal
The City of LA, Long Beach, and County are targeting 1 million tons of low-carbon alternatives per year by 2030
~66,000
Building Permits / Year
LA County issues more building permits annually than most states — each one represents concrete demand
That concrete does not all go to the same place and accordingly is not homogenous in its cement and carbon content. What the Low Carbon Concrete Taskforce calls ‘Placement Application’ matters greatly. A cross section of building permits reveals the distribution of concrete by strength category in the LA region.
As we see above, this significantly impacts which decarbonization pathways are needed concurrently for regional stacking.
Here is where regional geology directly dictates decarbonization strategy. Southern California's aggregates — primarily alluvial deposits from the LA River basin and desert washes — are generally sub-optimal: poorly graded, high absorption, and often rounded rather than angular.
When local aggregate is sub-optimal in shape, grading, or absorption, mix designers are forced to use a higher cement factor — substantially more Portland cement per cubic yard — to achieve the required structural performance and workability. A typical LA mix uses 564–658 lbs/CY of cementitious material, compared to 470–520 lbs/CY in markets with excellent glacial aggregate like the Upper Midwest.
This means every cubic yard poured in Southern California starts with a carbon penalty. The region cannot simply optimize its way out of the problem — the geology dictates it. This is precisely why stacking must be regional: the constraint is literally in the earth.
564–658
lbs/CY Cementitious
Typical Southern California mix (high cement factor)
470–520
lbs/CY Cementitious
Upper Midwest with excellent glacial aggregate
Step III: Where do we get our Concrete from?
The Ready Mix Network: Concrete's perishability means the delivery network is the market. A ready-mix truck must deliver within 90 minutes of batching — there is no warehouse, no inventory buffer, no container ship. This makes the network of batch plants the physical constraint on what can be poured, and where.
188
Ready-Mix Plants
Active batch facilities across the LA/OC MSA
1,500+
Mixer Trucks
Daily fleet navigating some of the worst traffic corridors in the country
~25 mi
Average Delivery Radius
Concrete literally cannot travel far — this defines the market boundary
7
Major Operators
CalPortland, CEMEX, National Ready Mix, Robertson's, and others control ~70% of volume
53%
SCM-Ready Plants
Only ~100 of 188 plants have silo infrastructure to handle supplementary cementitious materials
90 min
Pour Window
Concrete begins to set in 90 minutes — the clock starts the moment water hits cement at the plant
Step IV: Where does Concrete get its Ingredients from?
The Cementitious Supply Chain: The cementitious supply chain feeding LA is a concentrated network of desert kilns, port terminals, and long-distance rail corridors. Understanding this infrastructure is essential to designing a regional stacking plan — because you can only decarbonize what you can physically reach.
7
Cement Kilns
Victorville, Lucerne Valley, Mojave, Colton, Oro Grande — all in the Inland Empire / Mojave corridor
5M
Tons Cement / Year
Total cement consumed in the Southern California market annually
~850K
Tons via Import
Arriving by ship through the Ports of LA and Long Beach — a significant supply chain risk
~250K
Tons Local SCM
Total locally-sourced slag and fly ash available — far below a 50%+ substitution target
500+ mi
Rail SCM Corridor
Nevada and Arizona supply fly ash via long-haul rail — expensive and carbon-intensive transport
~2,700°F
Kiln Temperature
Limestone calcination releases ancient CO₂ at temperatures no renewable energy can avoid — this is the chemistry problem
Every building in LA & OC MSA starts with concrete, and concrete starts with cement. This diagram traces the physical supply chain — showing which facilities, terminals, and material sources feed the regional market and in what proportions.
Step V: The Stacking Math. What LA Needs to Decarbonize
Using Meta's open-source BOxCrete framework (Bayesian Optimization for Concrete) as a reference — which has validated that high-performance concrete can be achieved with drastically reduced clinker factors — we can calculate the gap between where LA is today and where it needs to be.
📍 Today (Status Quo)
🎯 Target (2040)
The Regional Gap
+2.75M tons/yr
Additional SCM supply needed — a nearly 5× increase over today’s 750K tons. Slag, calcined clay, limestone, and novel pozzolans must be sourced, stored, and distributed across 188 plants.
1.5M tons/yr
Remaining OPC clinker — with CCU capturing and mineralizing ~40% of residual process CO₂ into aggregates, curing agents, and building products across the 7 regional kilns.
This is the regional roadmap: build the SCM supply chain to displace 2.75 million additional tons of clinker, decarbonize the remaining kilns producing 1.5 million tons of OPC, and deploy CCU to capture and utilize ~40% of residual process CO₂ — mineralizing it into aggregates, curing concrete with captured carbon, and producing carbonate building products. All three must happen simultaneously. The City of LA, City of Long Beach, and County of Los Angeles — in partnership with USGBC California — have already begun this work through their LA28 Low-Carbon Concrete RFI, targeting 1 million tons of low-carbon alternatives per year by 2030, with findings to be published at Carbon Forward on September 17, 2026.
The Transition: Before & After
The Sankey diagrams below model the carbon emissions flow through the LA regional cement system — first as it operates today, then under the aggressive 2040 target scenario where SCM substitution reaches 70% and CCU captures and utilizes a major share of residual kiln emissions.
Today: 85% Clinker / 15% SCM
2040 Target: 30% Clinker / 70% SCM + CCU
In the 2040 scenario, chemical performance additives first improve concrete efficiency, safely reducing overall cement demand by ~10%. Simultaneously, regional kilns transition away from petcoke, substituting fossil fuels with zero-carbon biomass and municipal waste to significantly cut combustion emissions.
Of the remaining cementitious material, 70% of the volume comes from SCMs — displacing enormous amounts of clinker that would otherwise emit process CO₂. Finally, the remaining clinker is produced by kilns equipped with CCU technology that captures CO₂ at the stack and mineralizes it into permanent structural products like carbon-cured aggregates.
87%
Regional Emissions Reduction
Mix efficiency additives + alternative kiln fuels + SCM substitution + carbon utilization stack together to reduce LA regional emissions from ~3.8M to ~0.5M tons per year — achieved through regional infrastructure, not national mandates.
Emissions Transition Breakdown
Visualizing the 87% reduction from 3.86M to 0.50M tons CO₂
Quo
Additives
Switching
Avoidance
Capture
Target
Building Regional Resilience
Decarbonizing concrete requires recognizing that the solutions must be as localized as the materials themselves. Los Angeles teaches us that you cannot prescribe a national formula — you must understand the specific geology, infrastructure, and supply constraints of each region and design a stacking plan around them.
For LA, that means sourcing 2.75 million additional tons of SCMs per year, upgrading silo infrastructure at 88 plants, deploying CCU on 7 desert kilns to mineralize captured CO₂ into aggregates and building products, and constructing new calcined clay and limestone processing capacity. For the Great Lakes, the equation will be completely different. For the Gulf Coast, different again. But the architecture is the same: map the local supply chain, identify the constraints, calculate the gap, and stack the solutions that the physics of the region allow.
To change the system, we must build the system — region by region.
Continue exploring the Concrete Ideas series, or return to the overview.