The Concrete Atlas
Why decarbonizing cement and concrete requires high-resolution spatial awareness, and how the Concrete Atlas bridges the gap between macro-level climate goals and local bankability.
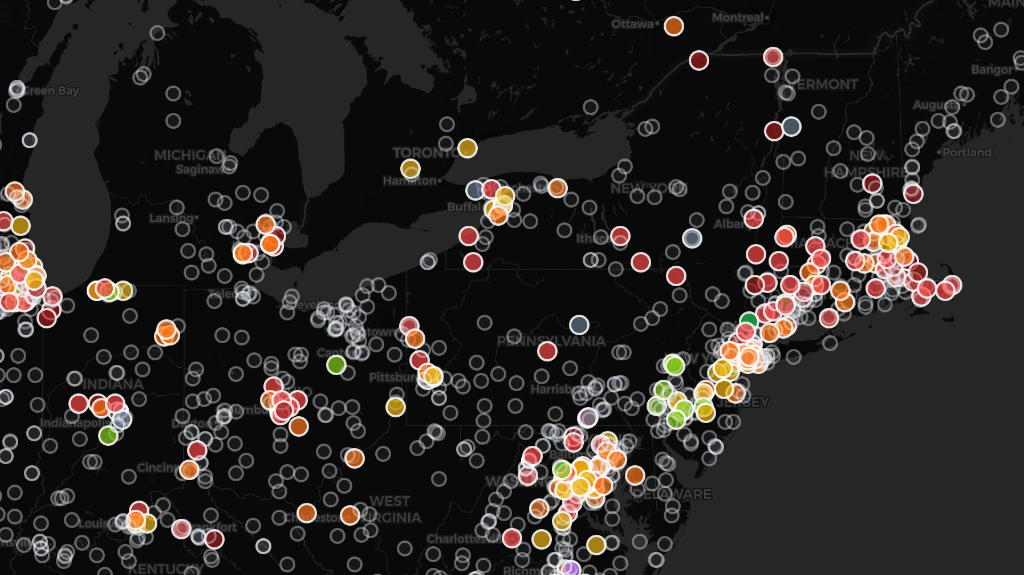
Ready-mix plants across the northeastern US, color-coded using the GCCA Low Carbon Concrete rating system at 4000 PSI. Each plant is graded on the best available EPD in its selected strength class — green indicates the lowest embodied carbon, red the highest, and gray means no EPD data at that PSI.
Executive Summary
Concrete is not one market. It is hundreds of regional systems, each with its own kilns, materials, competitors, and constraints. A decarbonization strategy that works in Houston may fail in Portland. The Atlas makes those differences visible.
The Concrete Atlas starts by mapping every cement plant and ready-mix facility in the country — with facility-level emissions data and competitive coverage — so users can begin to see how their regional concrete system actually works.
Users can navigate to any region and see which kilns serve it, how their emissions compare, where ready-mix plants cluster around demand, and how competitive coverage areas overlap.
The goal is situational awareness at the resolution where decisions are made — not global averages, but the plant-by-plant, region-by-region reality that determines whether a project gets financed, a spec gets written, or a policy drives adoption.
New layers are being added: SCM feedstock and manufacturing locations — so users know what ingredients are available for lower-carbon mixes — EPD coverage, construction permit data, and verified project case studies, because the most common question in the market is 'where has this actually been done?'
Concrete Is a Regional System
Cement and concrete are often discussed as a single global industry — 8 percent of CO₂ emissions, followed by generic solutions. But the sector is not one system. It is many. Each region has its own kilns, materials, competitors, and constraints.
A region where fly ash is abundant and cheap faces a fundamentally different transition than one where coal plant retirements have already tripled local fly ash prices. A region dominated by a single vertically integrated producer has different market dynamics than one with dozens of independent ready-mix operators. A state with a Buy Clean Act creates different incentives than one that actively resists regulation.
None of this can be seen in a national average. The product — the ton of cement, the cubic yard of concrete — is the output of a system. It is the system that determines whether decarbonization actually happens. The Atlas exists to make these systems visible.
The product is the output of a system. It is the system that determines whether decarbonization actually happens.
What the Concrete Atlas Does
The Concrete Atlas is a geospatial intelligence platform that makes regional concrete systems legible. It starts with the physical infrastructure: every cement kiln and every ready-mix batch plant in the country, individually mapped and queryable.
At the cement plant level, the Atlas maps facility-level emissions intensity. Where EPA GHGRP data is available, the Atlas uses it directly. Where it is not, a structured estimation hierarchy fills the gap — engineering estimates derived from kiln type and capacity, then regional defaults calibrated against known plants. Every estimate is transparent: users can see exactly how each number was derived.
The ready-mix layer reveals the downstream delivery network — the batch plants that produce the concrete that goes into buildings and infrastructure, and which cement kilns feed into them. The ready-mix layer also shows all EPDs for mixes offered by each plant. The EPDs are batched by PSI category (specialized uses are excluded) and mapped to the GCCA low carbon concrete rating system.
How We Rate Ready-Mix Plants
The GCCA Low Carbon Concrete Rating system grades individual concrete mixes, not plants. When you select a strength class on the Atlas (e.g. 4000 PSI), each plant's color reflects the best available EPD it offers in that PSI band — meaning the lowest declared GWP. We chose best-available rather than average because the question the Atlas is designed to answer is: what is the lowest-carbon concrete you can actually source from this facility at this strength?
This means a plant that publishes a wide range of EPDs — including both conventional and low-carbon mixes — will be rated by its best option, not penalized for also offering high-carbon products. A plant that publishes only a single low-carbon EPD will show the same grade as a plant whose best offering matches that level, even if the second plant also offers dozens of conventional mixes. We believe this is the right incentive structure: it rewards having at least one genuinely lower-carbon option available.
When no PSI filter is applied, the Atlas averages the rating across all strength classes to produce a composite grade. Plants with no EPD data at a given strength class appear as gray (unrated).
A Note on Cement Plant Emissions Data
Cement kiln emissions on the Atlas are sourced from the EPA Greenhouse Gas Reporting Program (GHGRP), which covers facilities emitting over 25,000 metric tons of CO₂e per year. This data captures process emissions from calcination and combustion, but does not reflect all operational variables — for example, whether a kiln is burning alternative fuels, has installed carbon capture equipment, or has made other process modifications that reduce its net intensity. Where GHGRP data is unavailable, the Atlas uses engineering estimates based on kiln type and capacity, followed by regional defaults. Every data source is labeled transparently so users understand the confidence level of each facility's reported emissions.
What You Can Do — By Role
The Atlas is not a static report. It is an interactive environment built for specific workflows. Here is what each audience can do with it today.
Policymakers and Regulators
Set embodied carbon thresholds that are both ambitious and feasible. A Buy Clean Act that sets limits without understanding what local producers can actually achieve risks being too lax to drive change or too aggressive to be complied with. The Atlas shows what the local supply chain is currently capable of — making it possible to design standards that pull the market forward without breaking it.
Technology Developers and Startups
Identify white-space opportunities — regions where demand is strong, incumbent emissions are high, and policy signals are favorable. See where existing SCM supply is constrained, creating market openings for new materials. Use the map to find the highest-probability sites for your first commercial facility.
Procurement Teams and Contractors
Find which producers near your project site can actually deliver lower-carbon concrete. See facility-level ratings, understand what drives the differences — kiln efficiency, SCM substitution, cement type — and evaluate whether those options are realistic for your application and spec requirements.
What We Are Building Next
The Atlas is a platform that grows as the transition demands more intelligence. New layers are in active development, each driven by what users and market participants are asking for.
SCM Feedstock and Manufacturing Locations
If you want to go lower carbon in a concrete mix, you need to know what ingredients are actually available in your region. This layer maps raw material feedstock locations — clay deposits, pozzolan sources, fly ash stockpiles, slag terminals — alongside the processing infrastructure needed to turn them into usable SCMs. A ready-mix producer in Phoenix cannot design a mix around a clay deposit in Georgia. Making that gap visible is how we close it.
LECC Producer and Facility Mapping
Where is the next generation of lower-carbon materials being built, planned, or proposed? Calcined clay plants, novel binder facilities, CCUS-equipped kilns, SCM grinding operations. This layer creates a forward-looking view of how the supply landscape is evolving.
Low-Carbon Concrete Project Case Studies
The single most common question we hear is: where has this actually been done? Verified project case studies — real buildings, real pavements, real infrastructure — layered onto the map by geography. A specifier in Dallas will be able to see what lower-carbon mixes have been placed successfully in their metro area, for what applications, and at what performance levels.
Seeing the System Clearly
The cement and concrete sector will not be decarbonized through a single technology, a single policy, or a single financial instrument. It will be decarbonized region by region, through interventions calibrated to each local system.
That requires the ability to see each regional system for what it is — its supply configuration, its competitive dynamics, its material constraints — and to act accordingly. That is what the Concrete Atlas provides.
Continue exploring how CTC approaches the cement transition — from financing mechanics to technology evaluation.