Concrete 101 · Fall 2026
Low-Carbon Concrete 101
The material, the numbers, the solutions, the money.
Cement is a quarter of the cost of a cubic yard and 82% of its carbon. This is our primer on where those emissions sit, the two ways to take them out, and why the plants that would do it still struggle to get financed.
Page 1 of 32
Contents
Read the text version
Page 1Low-Carbon Concrete 101
The material, the numbers, the solutions, the money.
Concrete Transition Capital · Fall 2026
Page 2What is in here
4 · I · The material: what concrete is, and why no two batches match.
7 · II · The numbers: what it costs, and who carries the load.
8 · The GCCA rating system.
11 · III · The solutions: two ways to zero, how they stack, and where we disagree.
18 · IV · The money: why the technology exists and the plants do not.
23 · V · Attribute certificates: separating the carbon from the tonne — and how to buy it.
28 · Glossary.
30 · References.
Page 3About concrete
Fun facts to impress your friends.
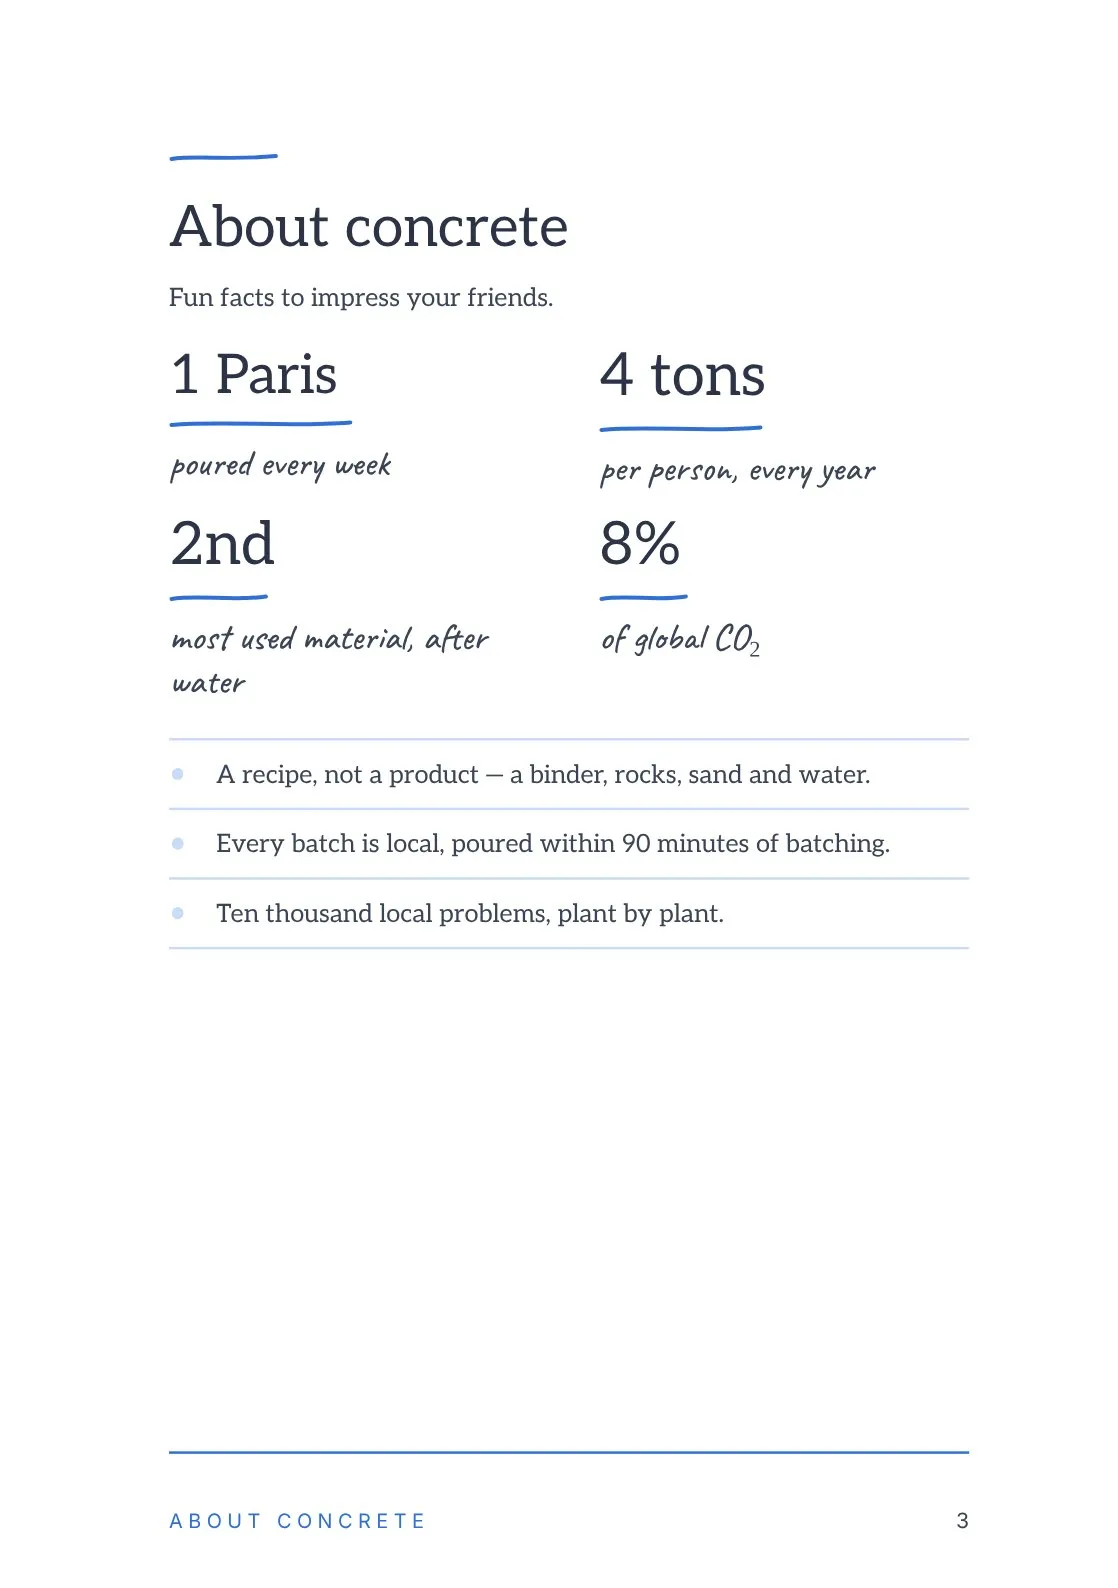
1 Paris poured every week. 4 tons per person, every year. 2nd most used material, after water. 8% of global CO₂.
A recipe, not a product — a binder, rocks, sand and water.
Every batch is local, poured within 90 minutes of batching.
Ten thousand local problems, plant by plant.
Page 4Five words I taught my family
They still get concrete and cement wrong.
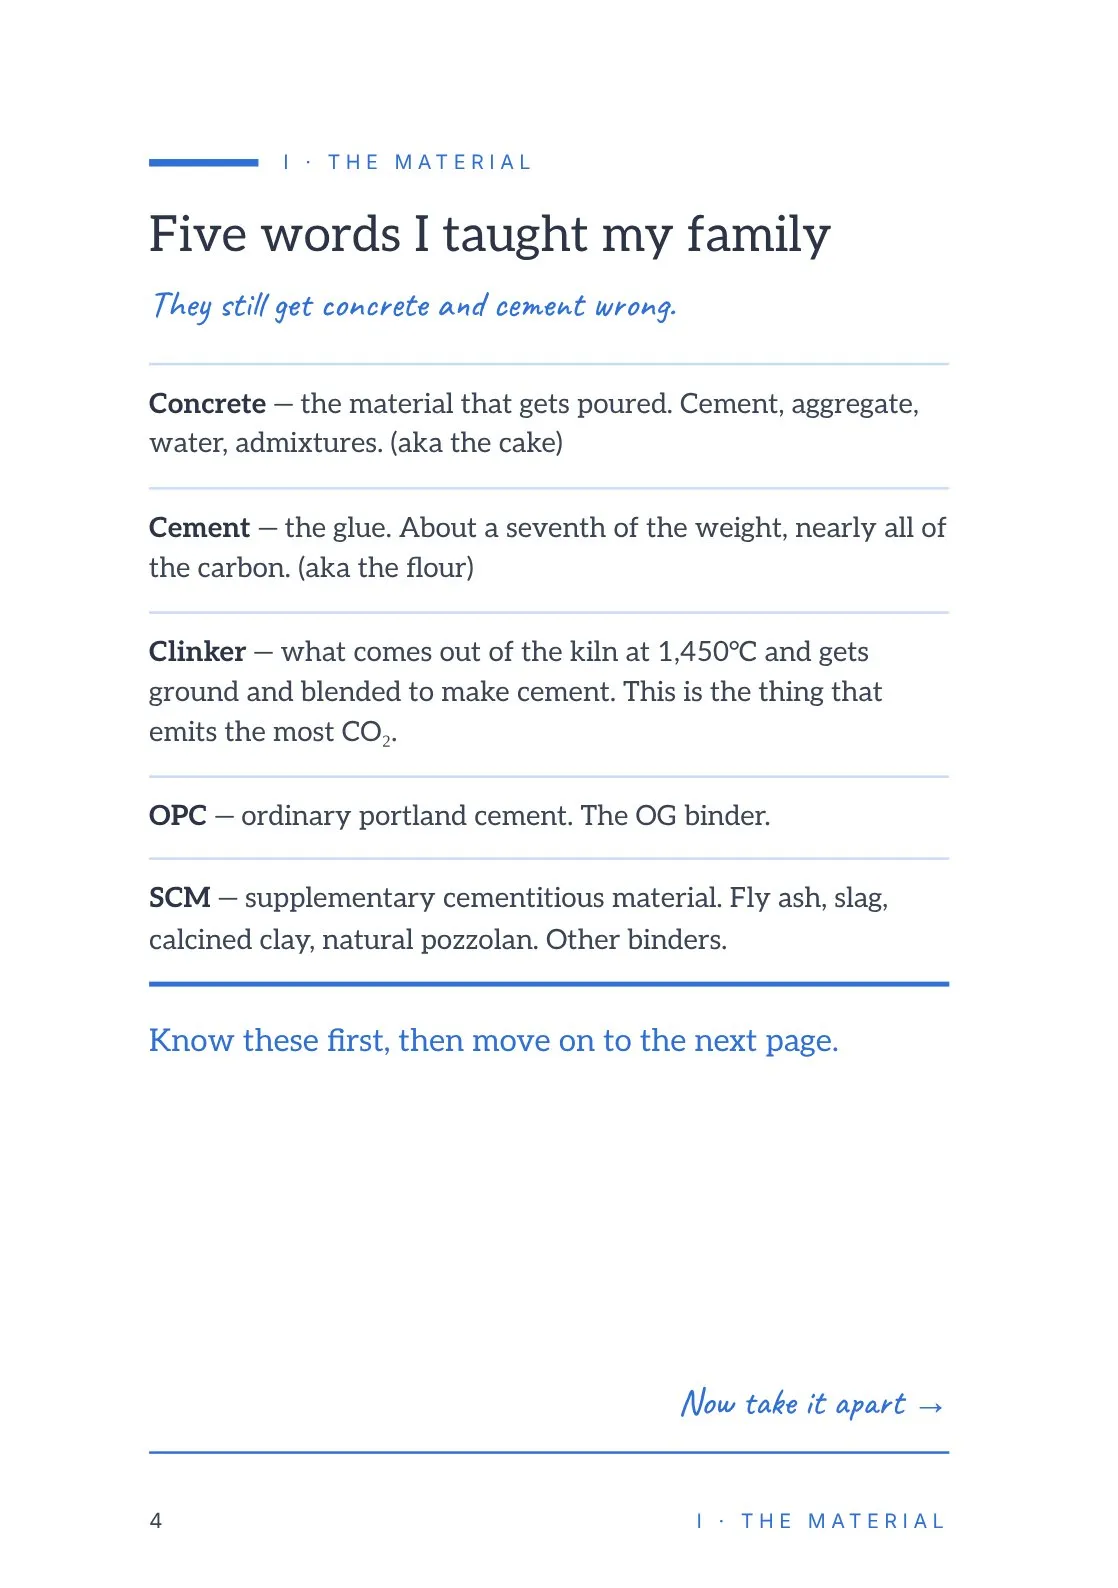
Concrete — the material that gets poured. Cement, aggregate, water, admixtures. (aka the cake)
Cement — the glue. About a seventh of the weight, nearly all of the carbon. (aka the flour)
Clinker — what comes out of the kiln at 1,450°C and gets ground and blended to make cement. This is the thing that emits the most CO₂.
OPC — ordinary portland cement. The OG binder.
SCM — supplementary cementitious material. Fly ash, slag, calcined clay, natural pozzolan. Other binders.
Know these first, then move on to the next page. Now take it apart.
Page 5Deconstructing Concrete
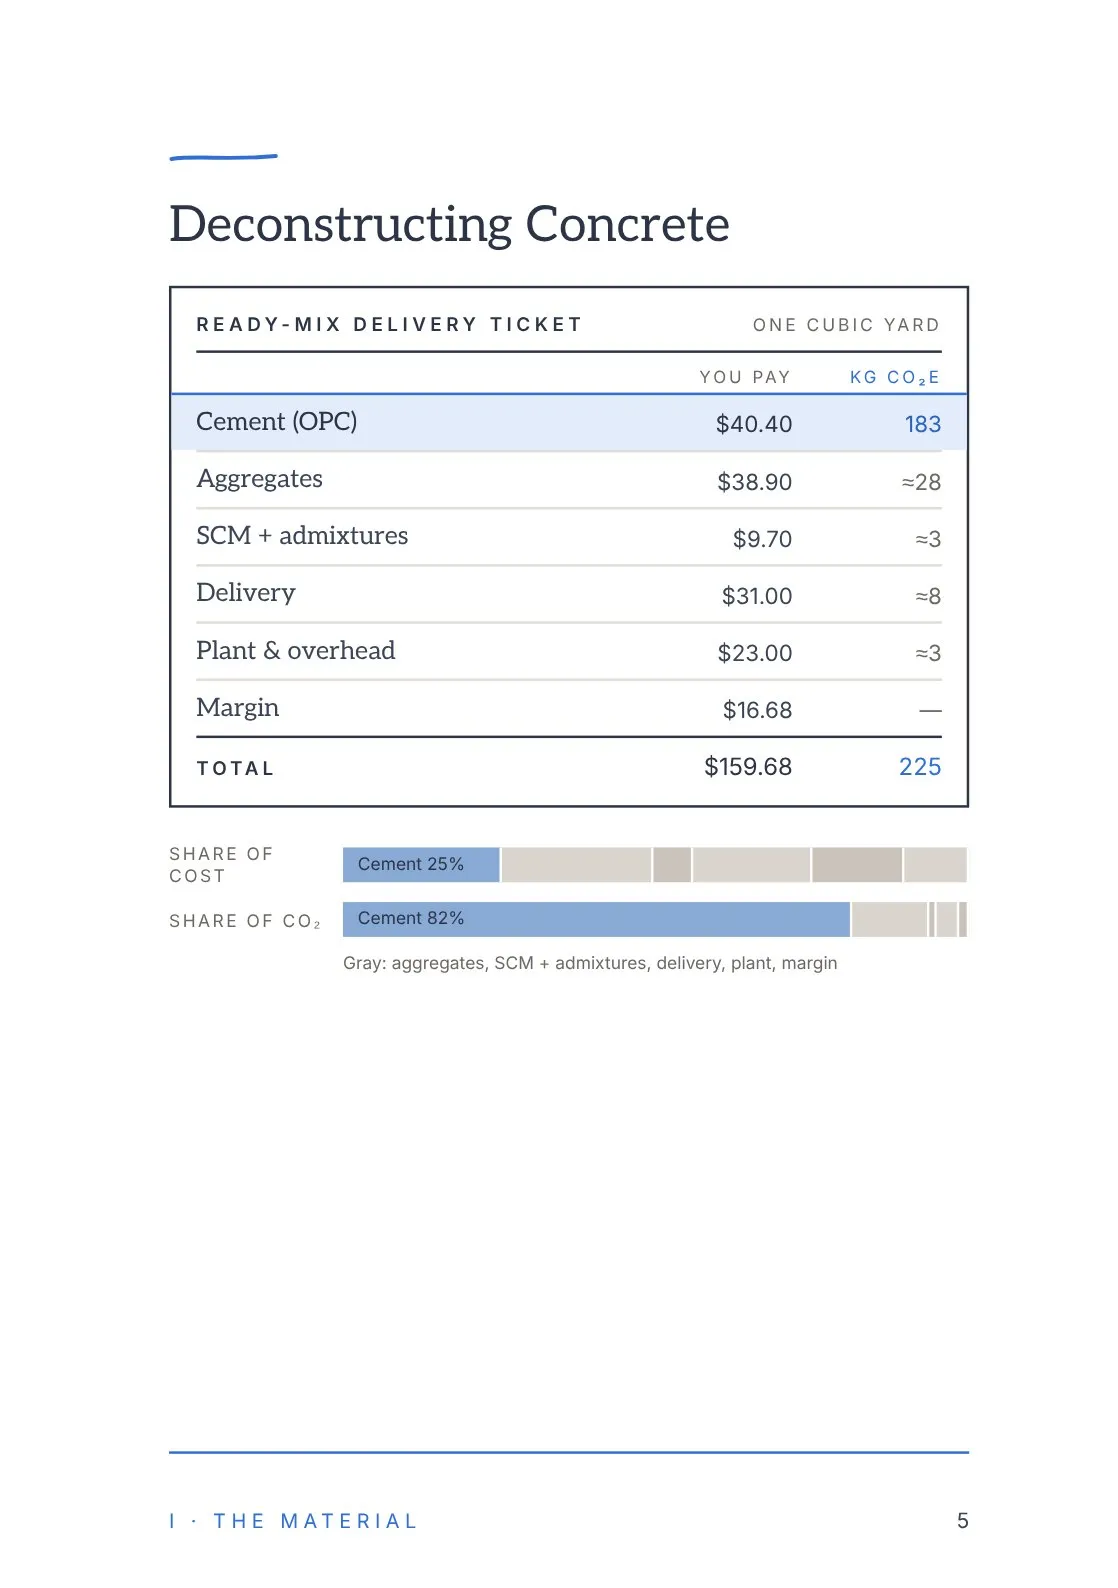
A ready-mix delivery ticket for one cubic yard, with what you pay and the kg CO₂e of each line:
Cement (OPC): $40.40, 183 kg. Aggregates: $38.90, about 28 kg. SCM + admixtures: $9.70, about 3 kg. Delivery: $31.00, about 8 kg. Plant & overhead: $23.00, about 3 kg. Margin: $16.68.
Total: $159.68 and 225 kg CO₂e.
Cement is 25% of the cost and 82% of the CO₂.
Page 6Where the emissions actually sit
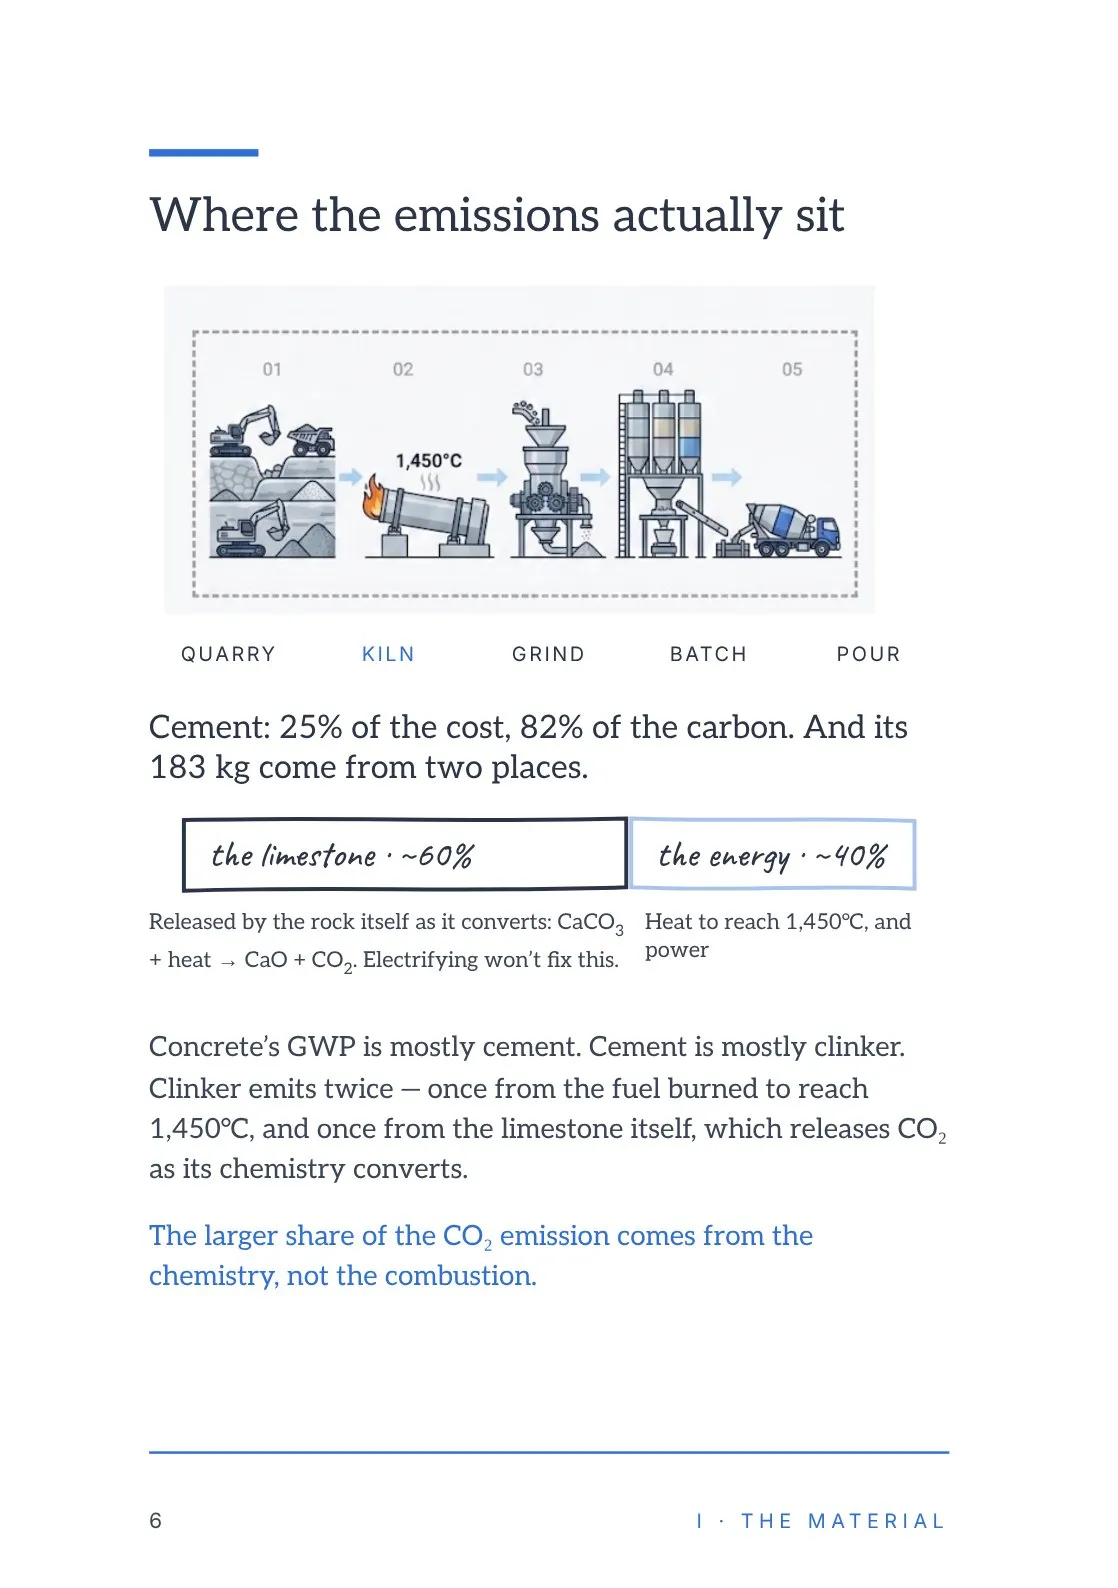
Illustration: the five steps from rock to pour — quarry, kiln at 1,450°C, grind, batch, pour.
Cement: 25% of the cost, 82% of the carbon. And its 183 kg come from two places.
The limestone, about 60%: released by the rock itself as it converts, CaCO₃ + heat → CaO + CO₂. Electrifying won’t fix this.
The energy, about 40%: heat to reach 1,450°C, and power.
Concrete’s GWP is mostly cement. Cement is mostly clinker. Clinker emits twice — once from the fuel burned to reach 1,450°C, and once from the limestone itself, which releases CO₂ as its chemistry converts.
The larger share of the CO₂ emission comes from the chemistry, not the combustion.
Page 7What it costs today
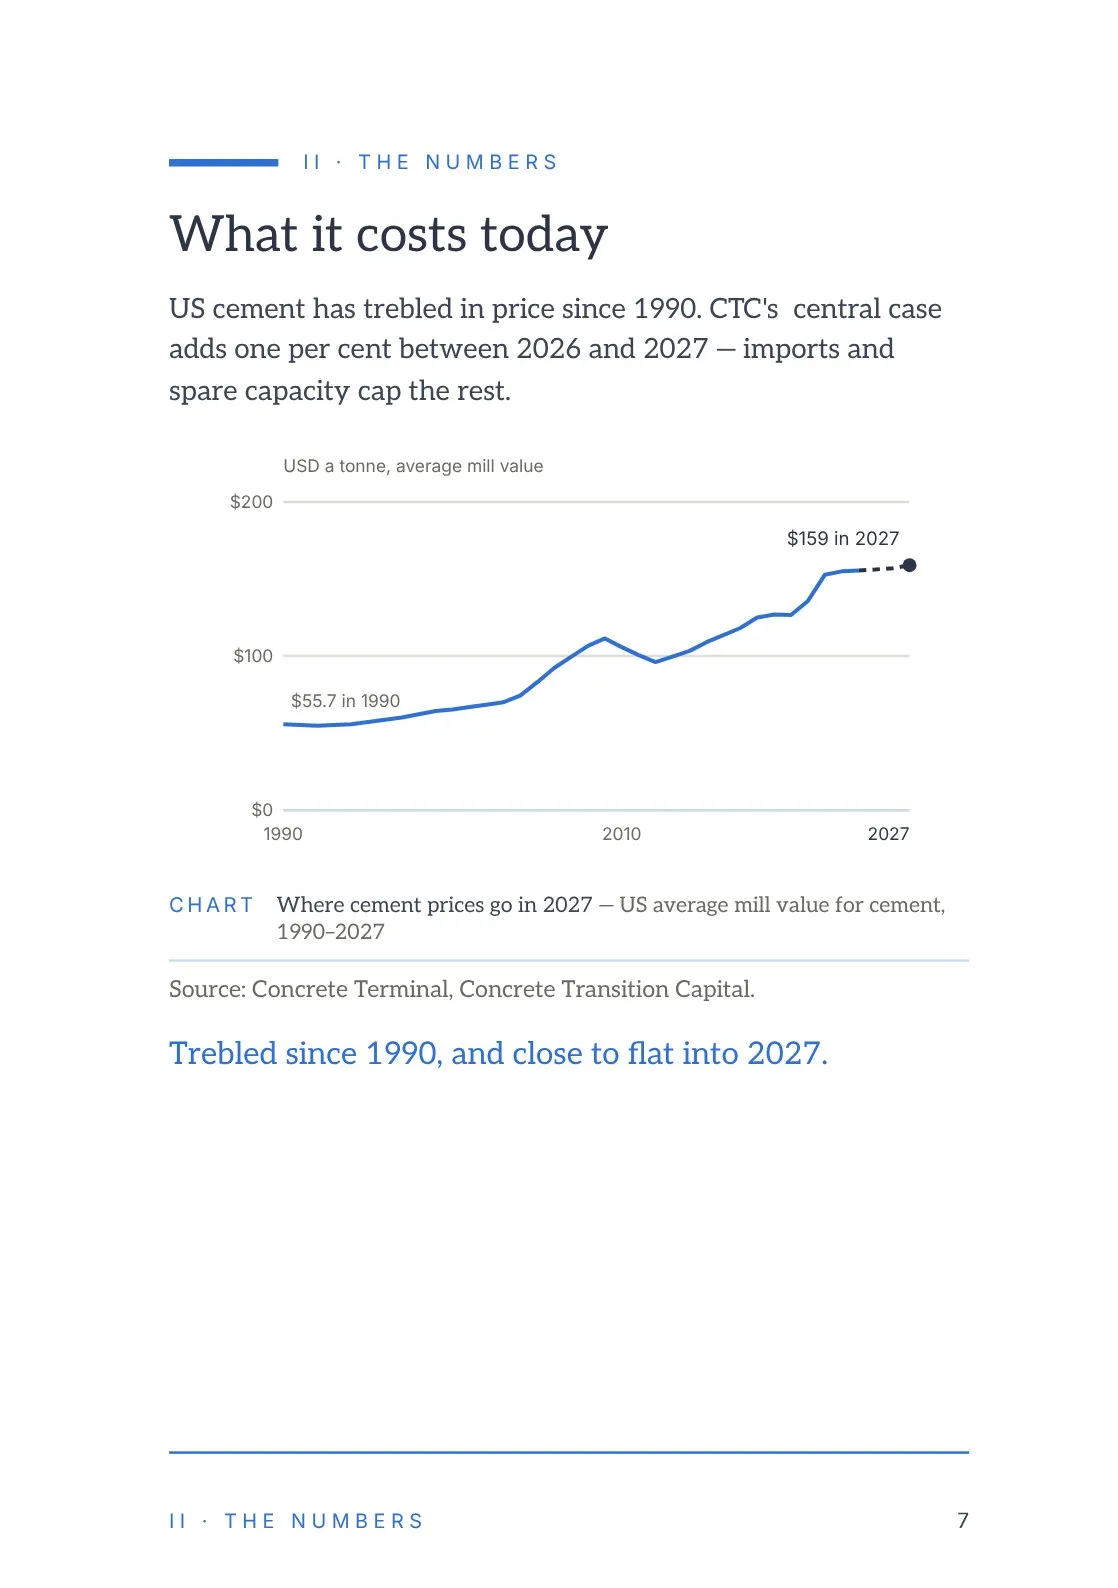
US cement has trebled in price since 1990. CTC’s central case adds one per cent between 2026 and 2027 — imports and spare capacity cap the rest.
Chart: US average mill value for cement, in dollars a tonne, 1990–2027. It climbs from $55.7 in 1990 to $159 in 2027, with a dip after 2008.
Source: Concrete Terminal, Concrete Transition Capital.
Trebled since 1990, and close to flat into 2027.
Page 8How we define low-carbon concrete
In 2025 the Global Cement and Concrete Association, the industry’s own body, launched Low Carbon Ratings: the first global scale for grading concrete by carbon footprint, from AA at near zero to G, open ended.
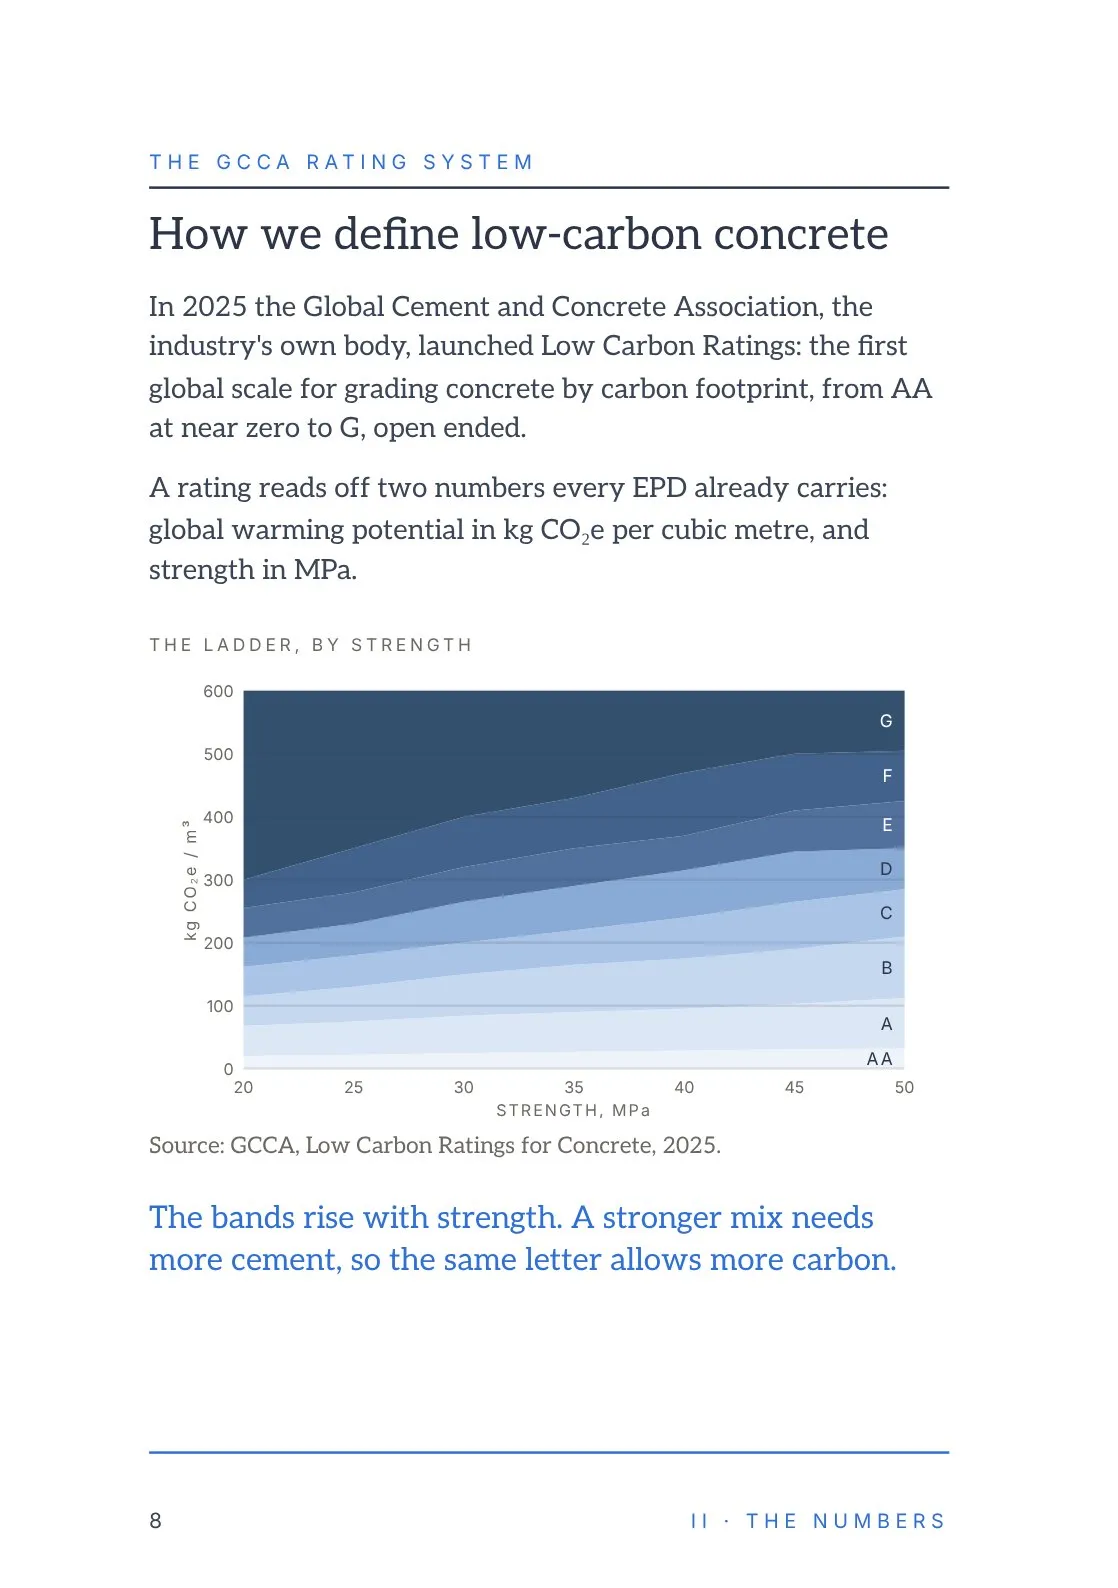
A rating reads off two numbers every EPD already carries: global warming potential in kg CO₂e per cubic metre, and strength in MPa.
Chart: the ladder of bands, AA through G, plotted as kg CO₂e per m³ against strength from 20 to 50 MPa. Every band rises with strength.
Source: GCCA, Low Carbon Ratings for Concrete, 2025.
The bands rise with strength. A stronger mix needs more cement, so the same letter allows more carbon.
Page 9What decarbonized concrete costs
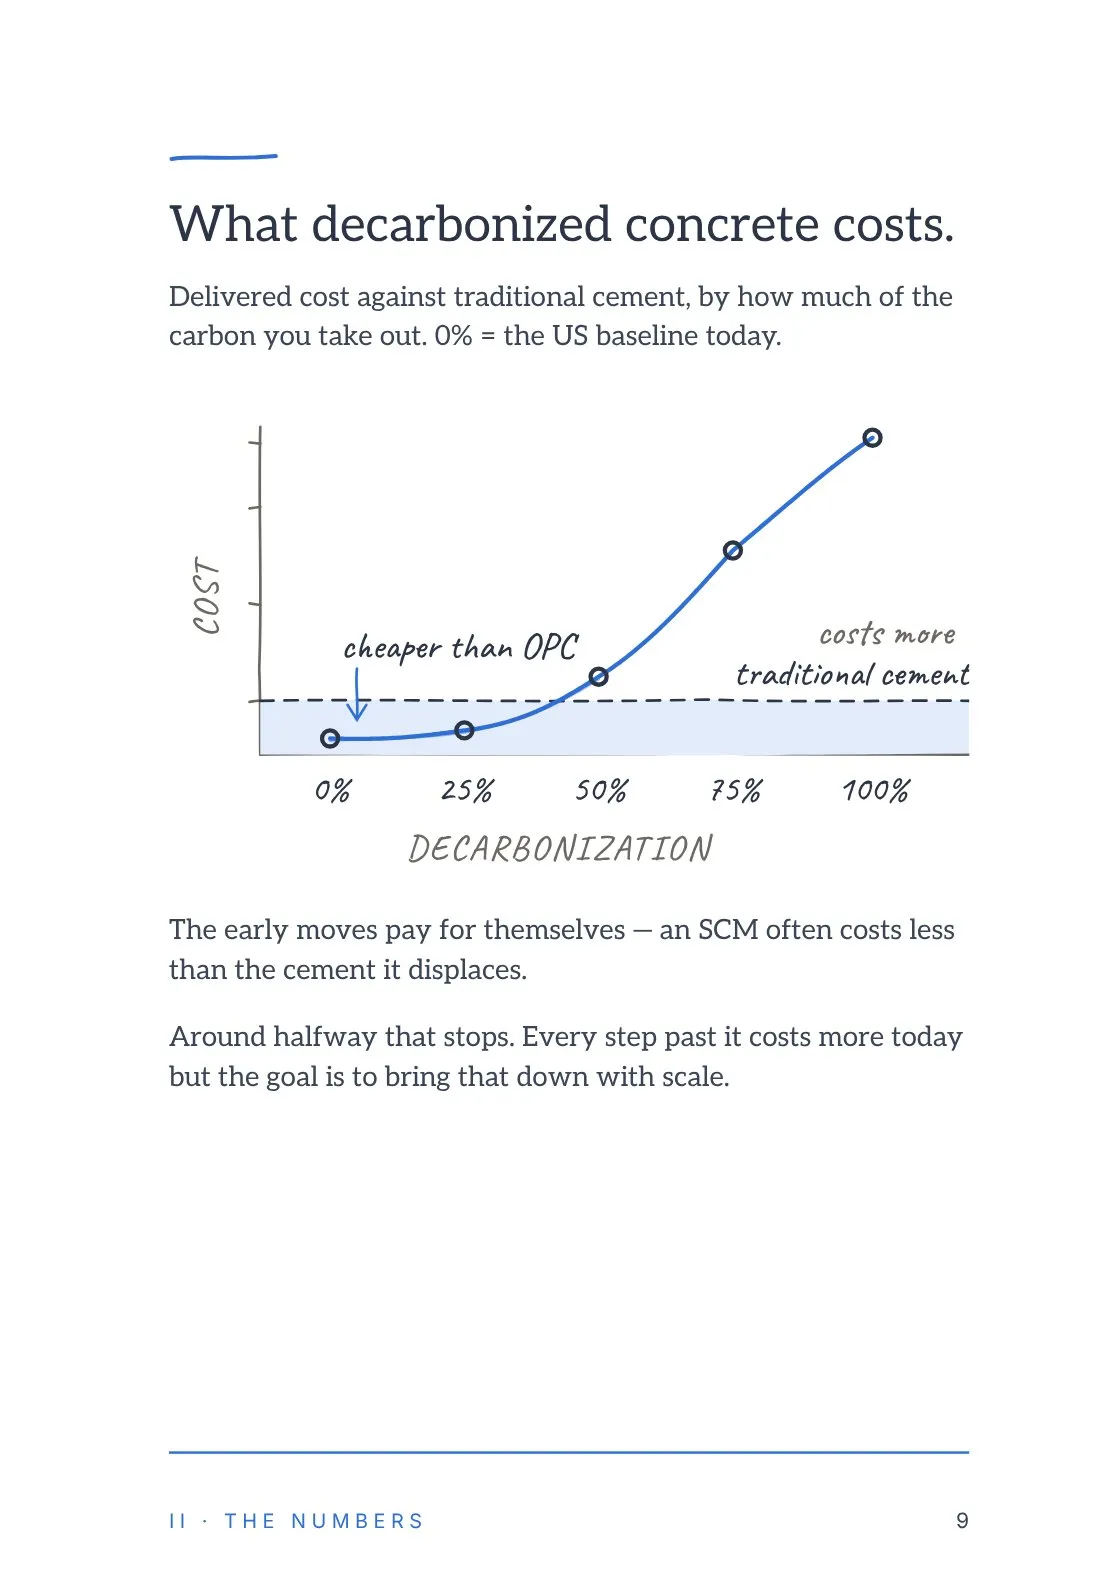
Delivered cost against traditional cement, by how much of the carbon you take out. 0% = the US baseline today.
Chart: cost against decarbonization from 0% to 100%. The curve sits below traditional cement up to about 25%, crosses it near 50%, then rises steeply to 100%.
The early moves pay for themselves — an SCM often costs less than the cement it displaces.
Around halfway that stops. Every step past it costs more today but the goal is to bring that down with scale.
Page 102050 is won or lost in the global south
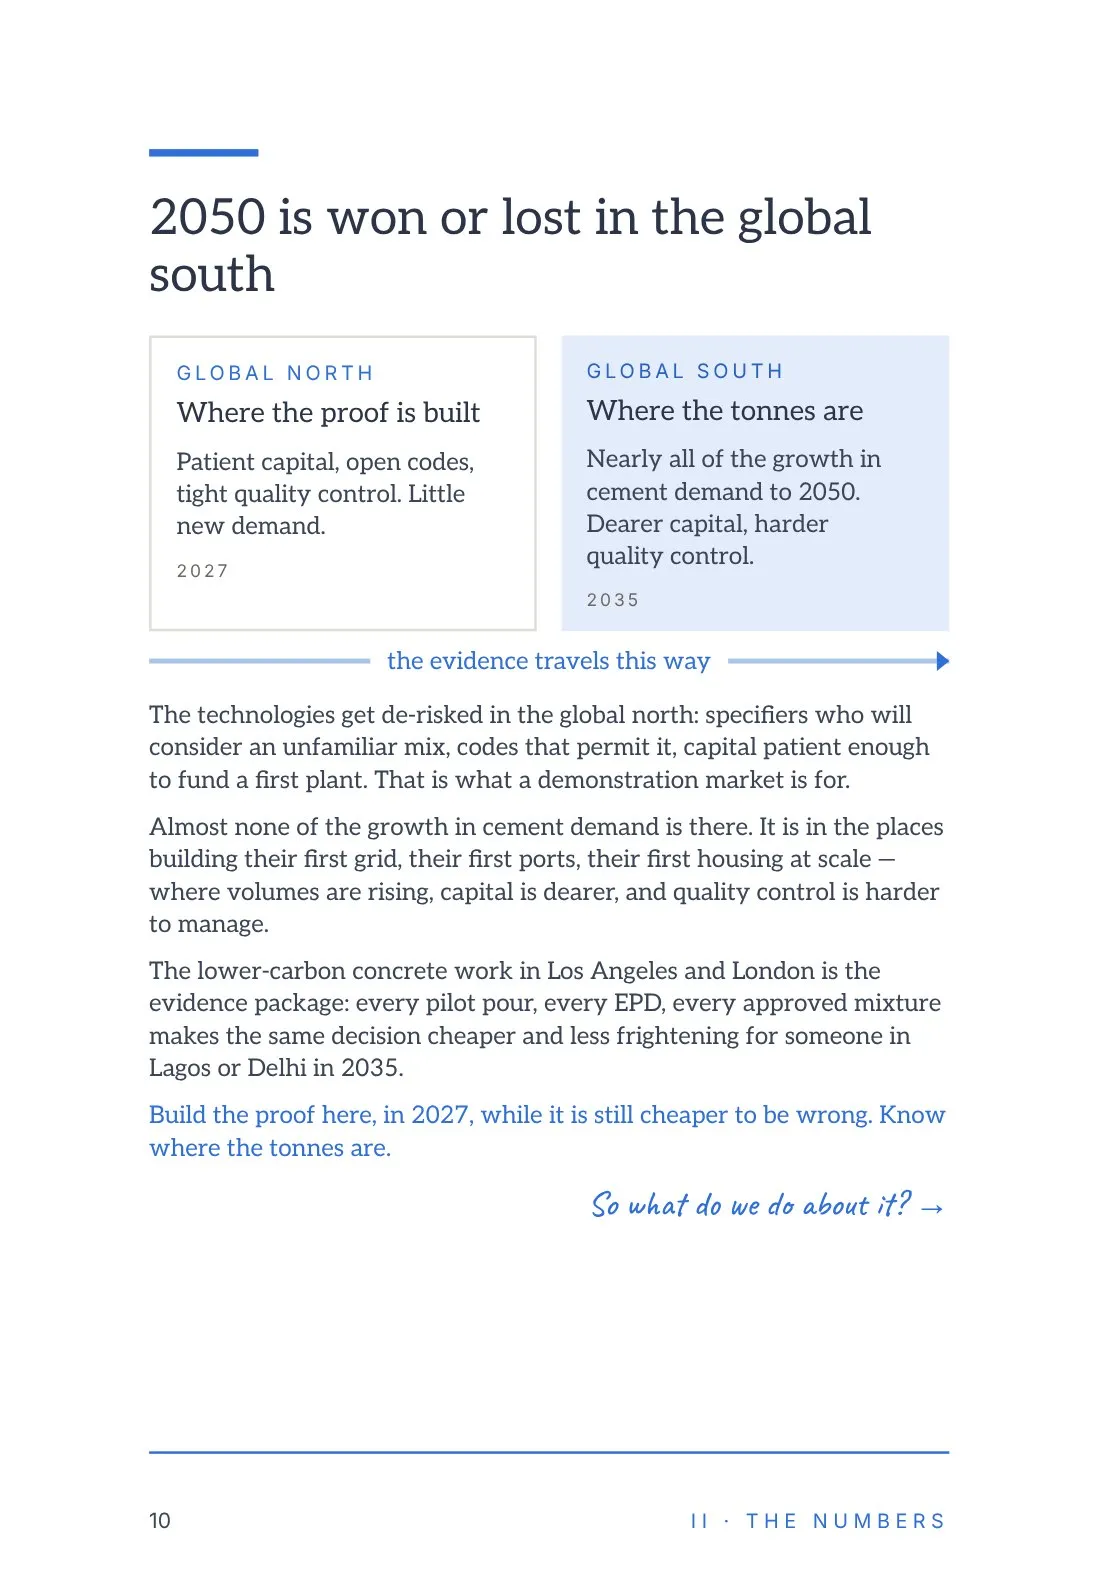
Global north, 2027: where the proof is built. Patient capital, open codes, tight quality control. Little new demand.
Global south, 2035: where the tonnes are. Nearly all of the growth in cement demand to 2050. Dearer capital, harder quality control.
The evidence travels from north to south.
The technologies get de-risked in the global north: specifiers who will consider an unfamiliar mix, codes that permit it, capital patient enough to fund a first plant. That is what a demonstration market is for.
Almost none of the growth in cement demand is there. It is in the places building their first grid, their first ports, their first housing at scale — where volumes are rising, capital is dearer, and quality control is harder to manage.
The lower-carbon concrete work in Los Angeles and London is the evidence package: every pilot pour, every EPD, every approved mixture makes the same decision cheaper and less frightening for someone in Lagos or Delhi in 2035.
Build the proof here, in 2027, while it is still cheaper to be wrong. Know where the tonnes are.
So what do we do about it?
Page 11Two ways to decarbonize cement
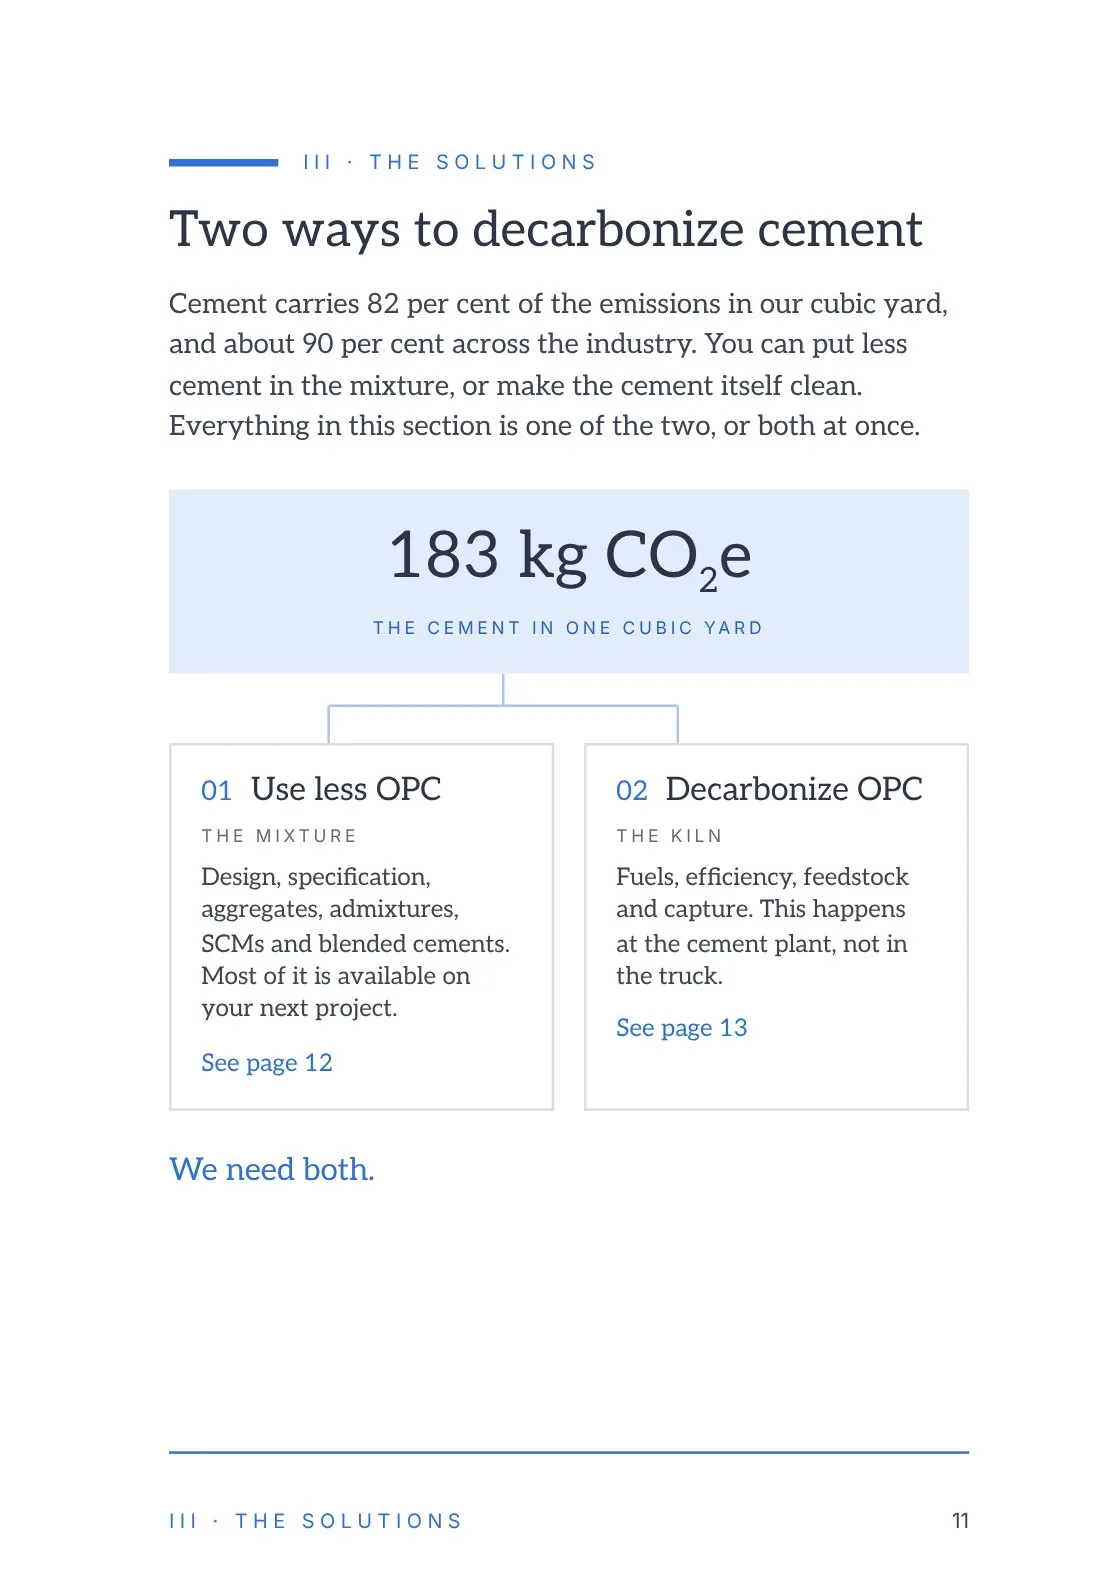
Cement carries 82 per cent of the emissions in our cubic yard, and about 90 per cent across the industry. You can put less cement in the mixture, or make the cement itself clean. Everything in this section is one of the two, or both at once.
183 kg CO₂e: the cement in one cubic yard.
01 Use less OPC — the mixture. Design, specification, aggregates, admixtures, SCMs and blended cements. Most of it is available on your next project. See page 12.
02 Decarbonize OPC — the kiln. Fuels, efficiency, feedstock and capture. This happens at the cement plant, not in the truck. See page 13.
We need both.
Page 12Use less OPC
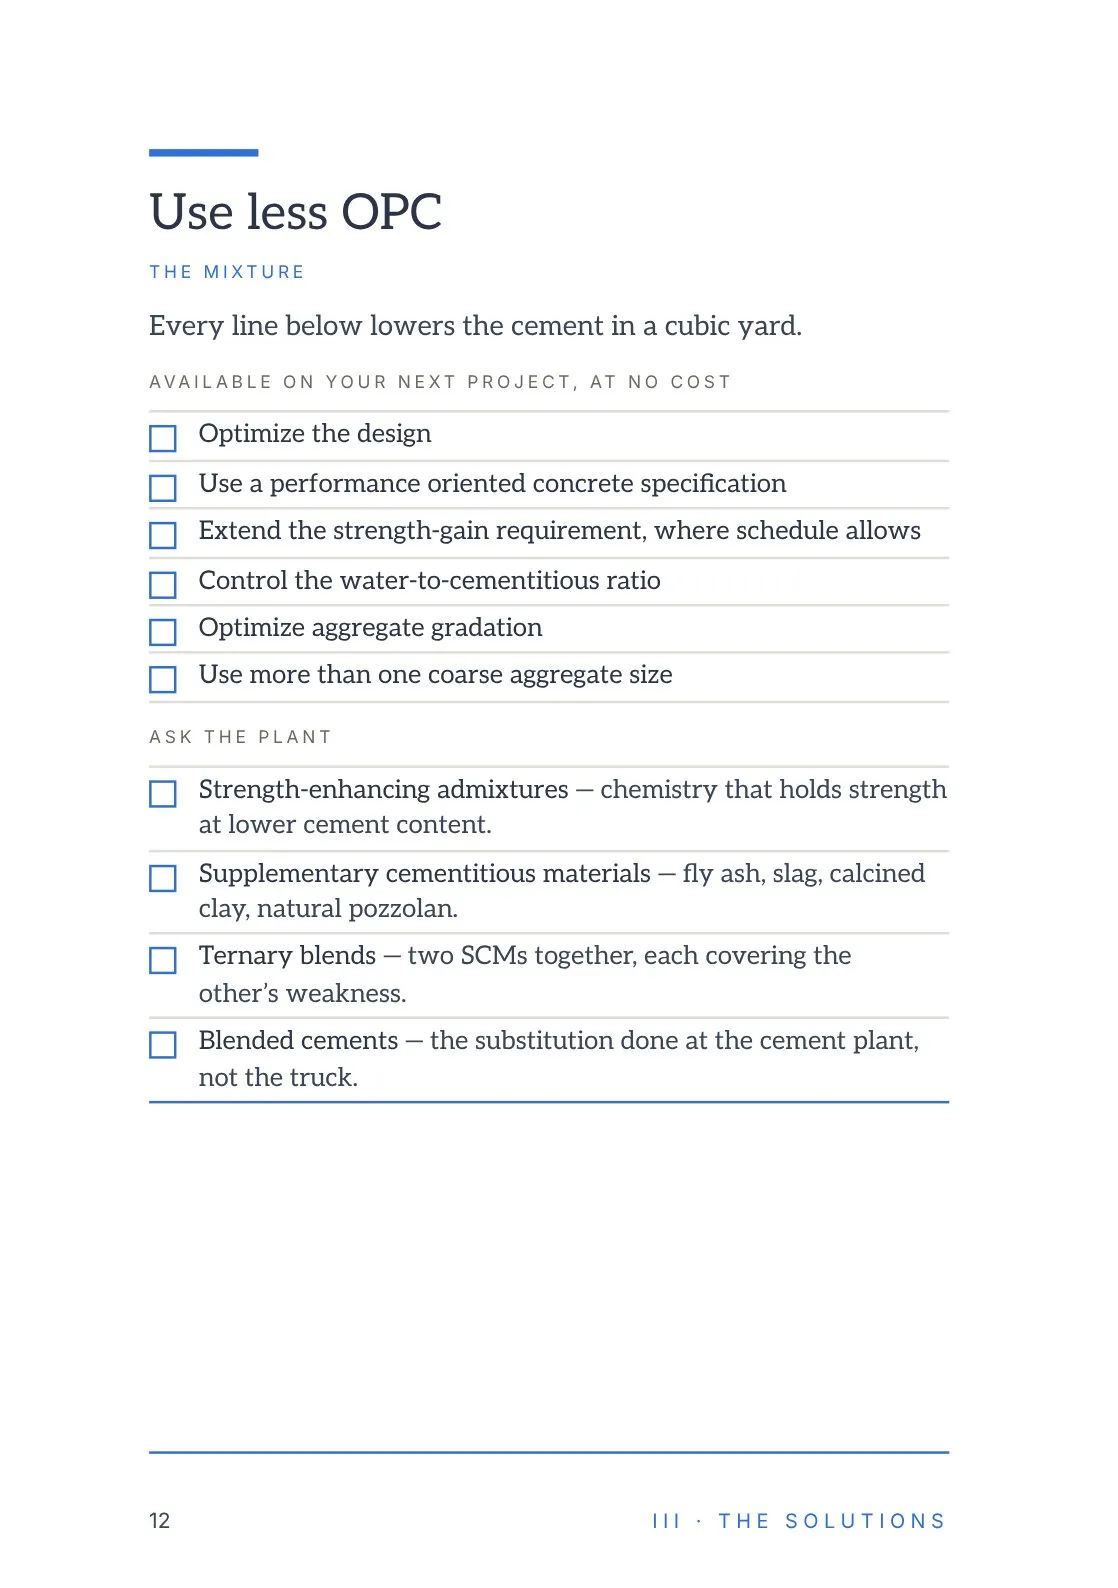
The mixture. Every line below lowers the cement in a cubic yard.
Available on your next project, at no cost: optimize the design; use a performance oriented concrete specification; extend the strength-gain requirement, where schedule allows; control the water-to-cementitious ratio; optimize aggregate gradation; use more than one coarse aggregate size.
Ask the plant: strength-enhancing admixtures — chemistry that holds strength at lower cement content. Supplementary cementitious materials — fly ash, slag, calcined clay, natural pozzolan. Ternary blends — two SCMs together, each covering the other’s weakness. Blended cements — the substitution done at the cement plant, not the truck.
Page 13Decarbonize OPC
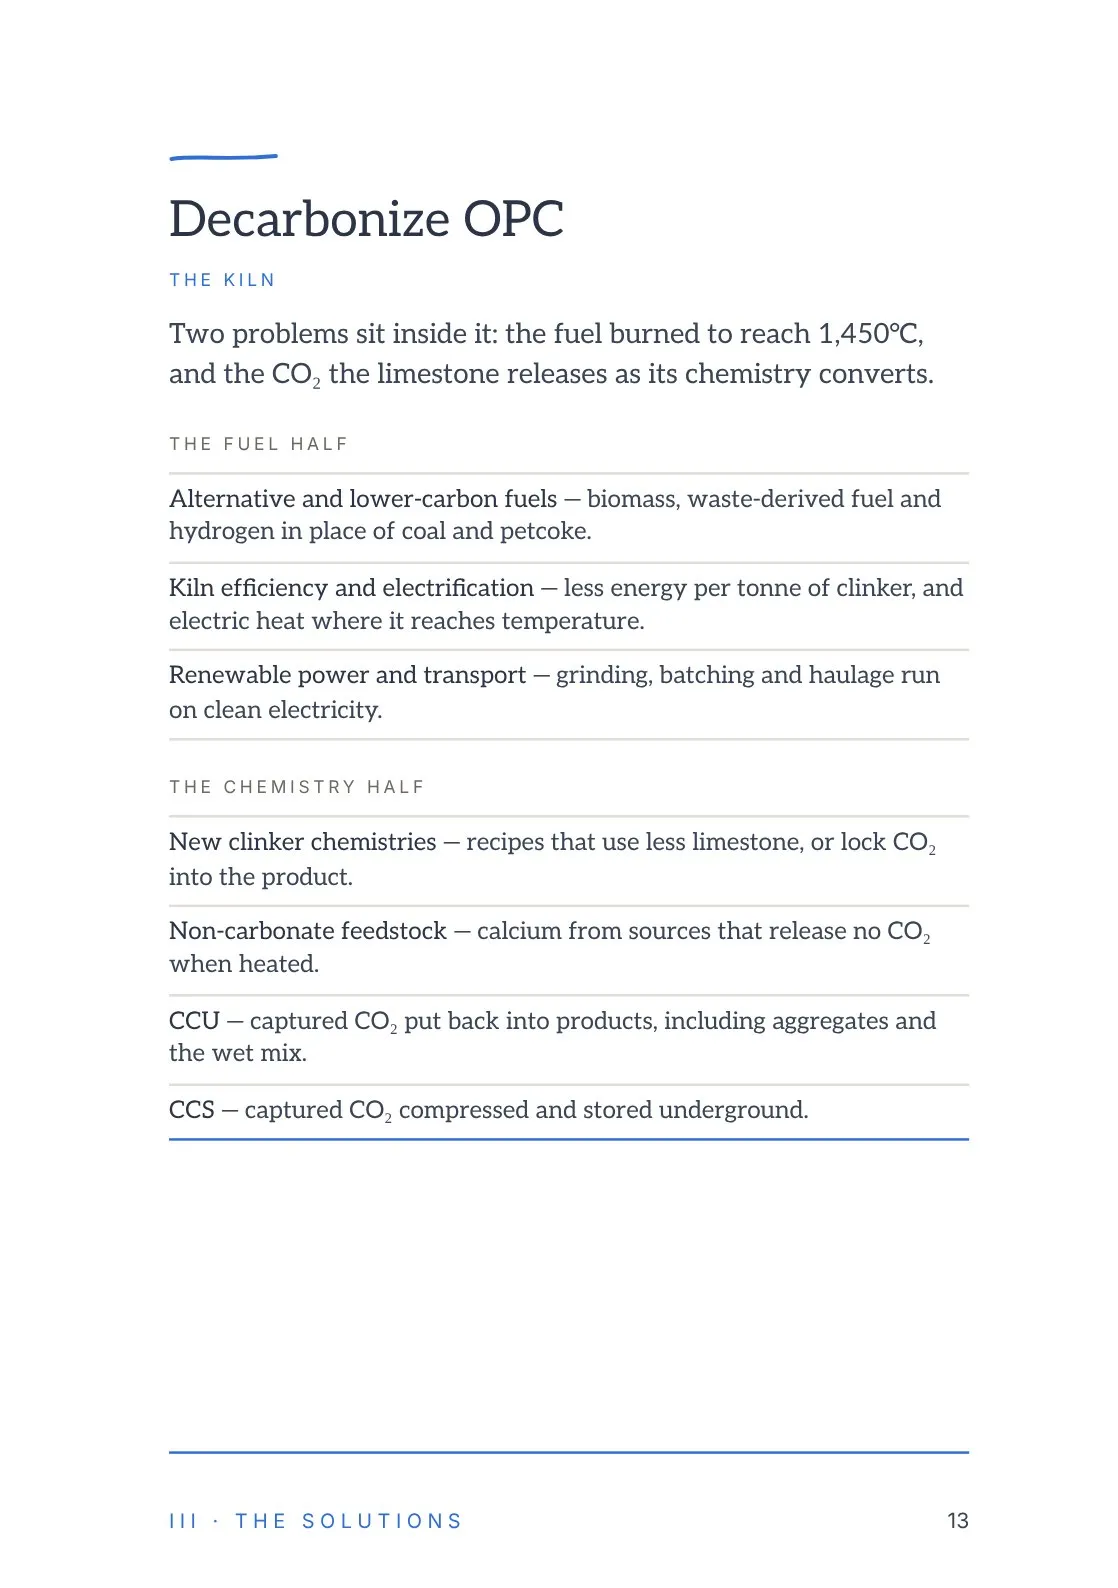
The kiln. Two problems sit inside it: the fuel burned to reach 1,450°C, and the CO₂ the limestone releases as its chemistry converts.
The fuel half. Alternative and lower-carbon fuels — biomass, waste-derived fuel and hydrogen in place of coal and petcoke. Kiln efficiency and electrification — less energy per tonne of clinker, and electric heat where it reaches temperature. Renewable power and transport — grinding, batching and haulage run on clean electricity.
The chemistry half. New clinker chemistries — recipes that use less limestone, or lock CO₂ into the product. Non-carbonate feedstock — calcium from sources that release no CO₂ when heated. CCU — captured CO₂ put back into products, including aggregates and the wet mix. CCS — captured CO₂ compressed and stored underground.
Page 14The two stack
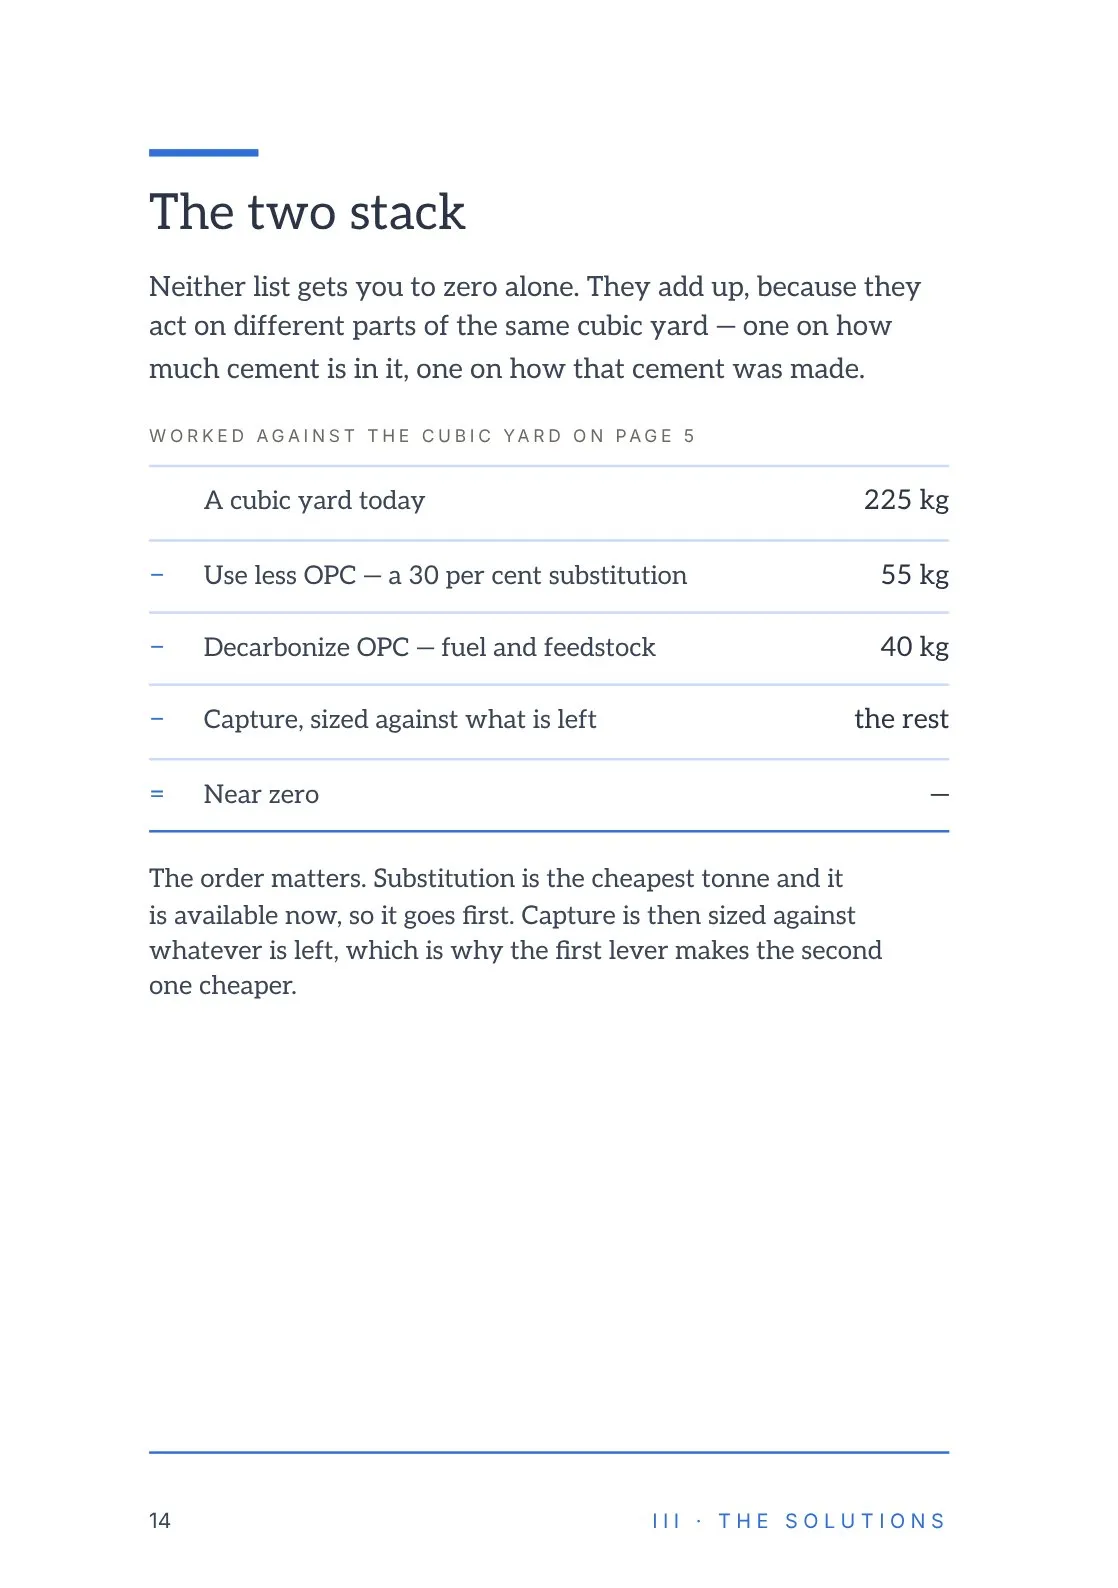
Neither list gets you to zero alone. They add up, because they act on different parts of the same cubic yard — one on how much cement is in it, one on how that cement was made.
Worked against the cubic yard on page 5: a cubic yard today, 225 kg. Less 55 kg from using less OPC, a 30 per cent substitution. Less 40 kg from decarbonizing OPC, fuel and feedstock. Less the rest from capture, sized against what is left. Equals near zero.
The order matters. Substitution is the cheapest tonne and it is available now, so it goes first. Capture is then sized against whatever is left, which is why the first lever makes the second one cheaper.
Page 15The waterfall to zero
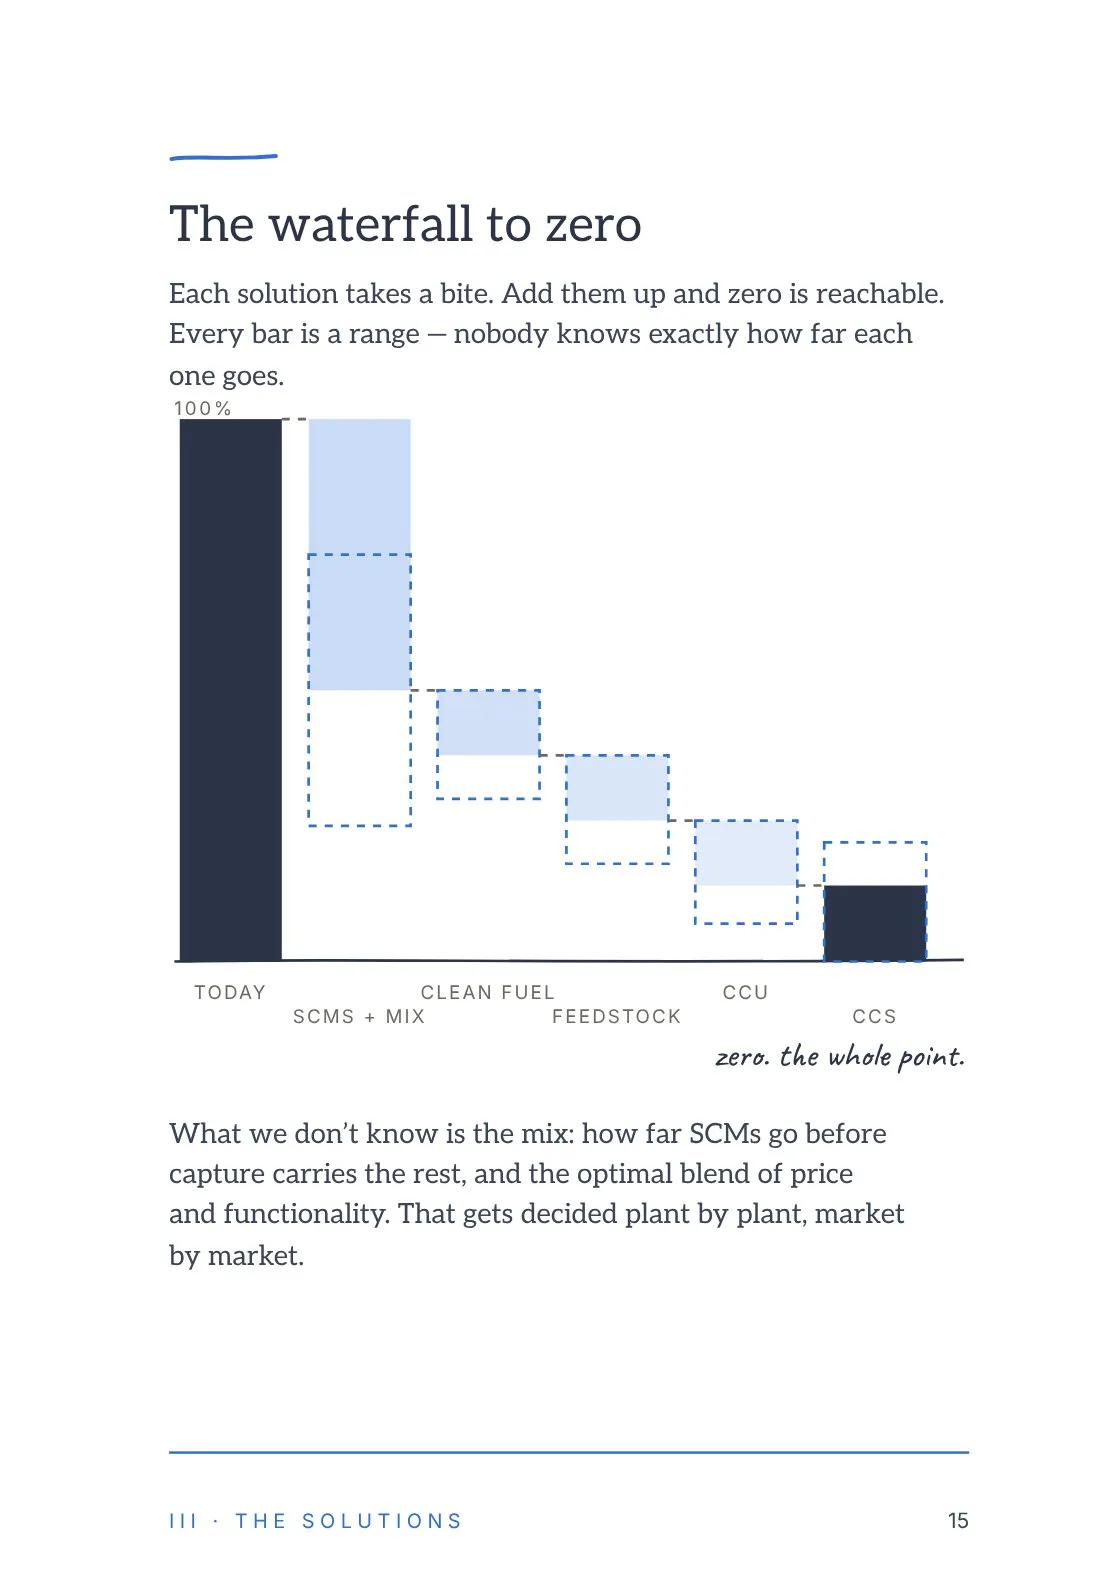
Each solution takes a bite. Add them up and zero is reachable. Every bar is a range — nobody knows exactly how far each one goes.
Chart: a waterfall from today’s 100% down through SCMs + mix, clean fuel, feedstock, CCU and CCS to zero. SCMs + mix take the largest bite.
Zero. The whole point.
What we don’t know is the mix: how far SCMs go before capture carries the rest, and the optimal blend of price and functionality. That gets decided plant by plant, market by market.
Page 16Our criteria
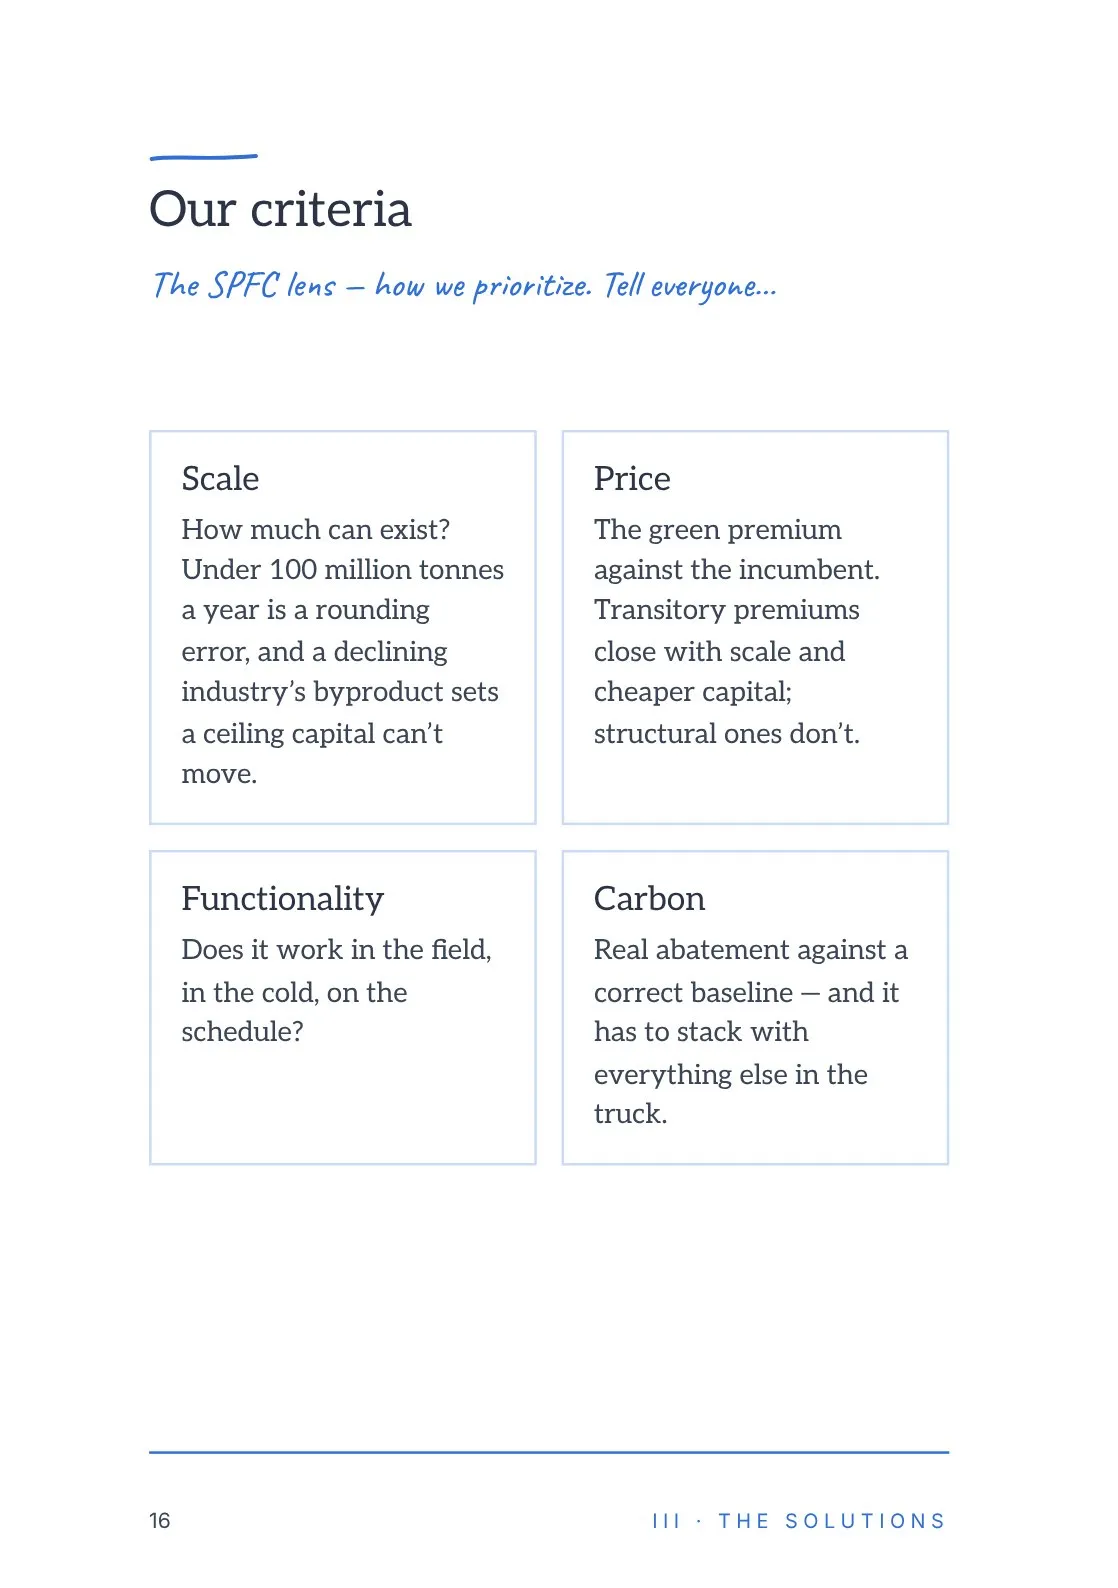
The SPFC lens — how we prioritize. Tell everyone…
Scale. How much can exist? Under 100 million tonnes a year is a rounding error, and a declining industry’s byproduct sets a ceiling capital can’t move.
Price. The green premium against the incumbent. Transitory premiums close with scale and cheaper capital; structural ones don’t.
Functionality. Does it work in the field, in the cold, on the schedule?
Carbon. Real abatement against a correct baseline — and it has to stack with everything else in the truck.
Page 17CCUS
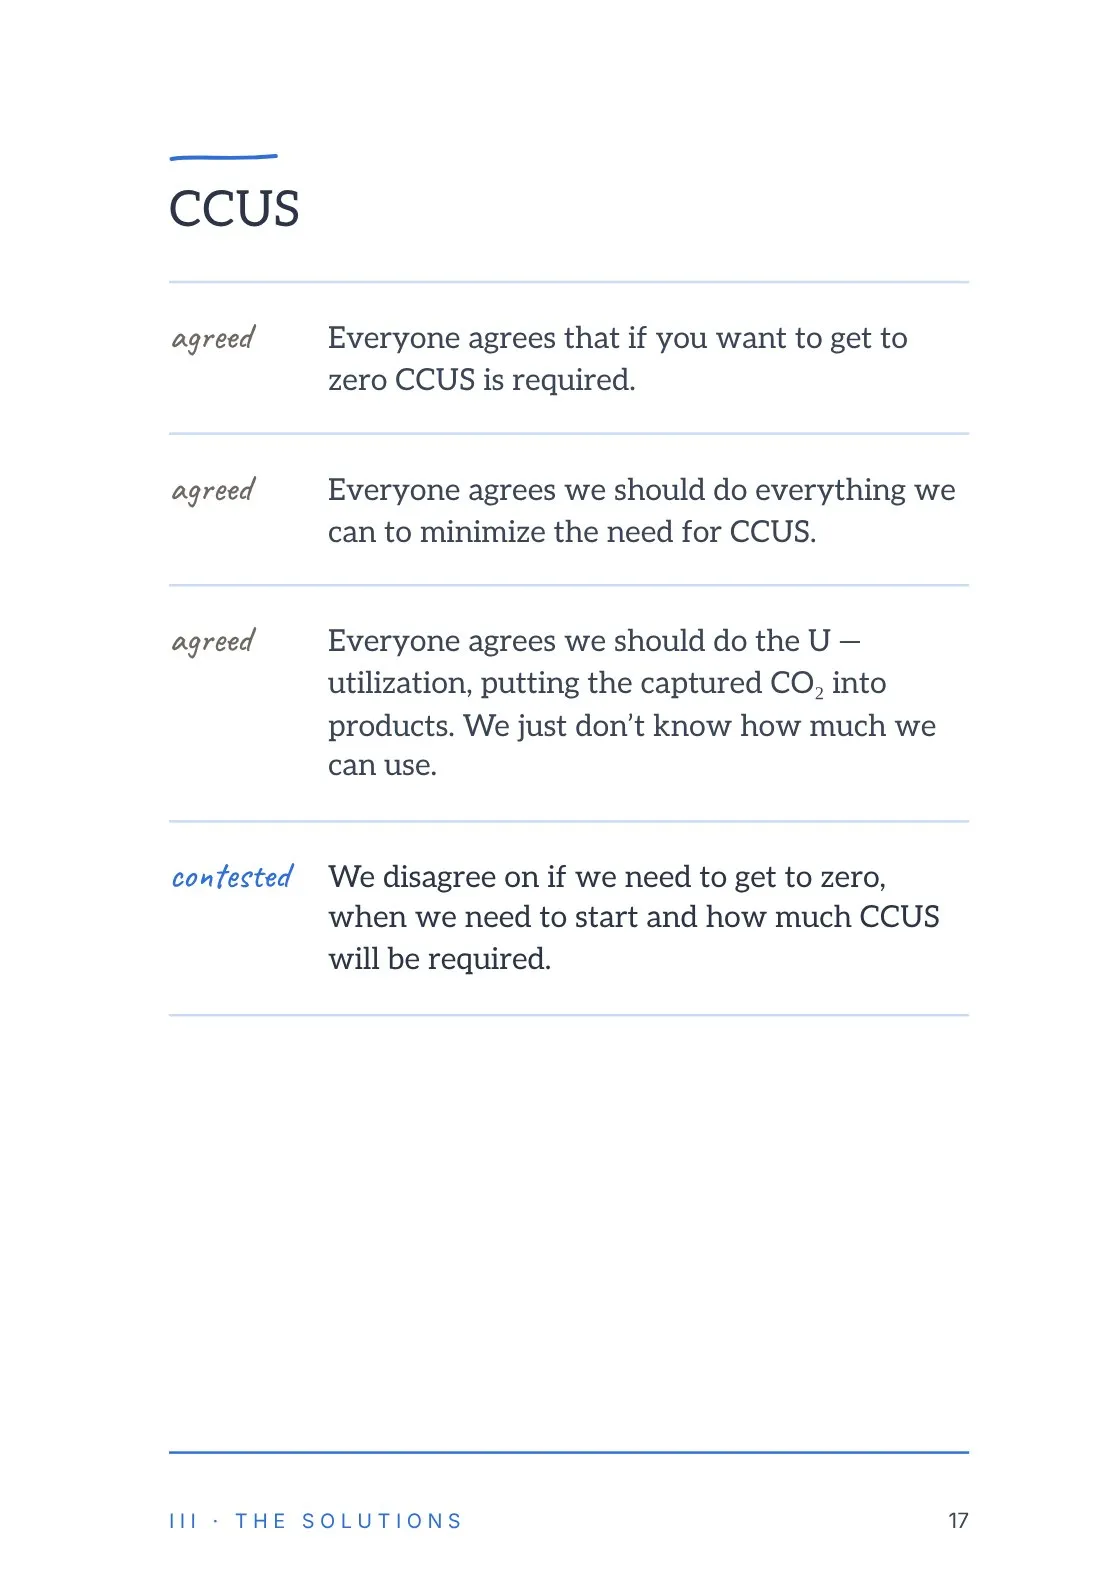
Agreed: everyone agrees that if you want to get to zero CCUS is required.
Agreed: everyone agrees we should do everything we can to minimize the need for CCUS.
Agreed: everyone agrees we should do the U — utilization, putting the captured CO₂ into products. We just don’t know how much we can use.
Contested: we disagree on if we need to get to zero, when we need to start and how much CCUS will be required.
Page 18The valley of death
Where they stall, and why you can’t buy them everywhere.
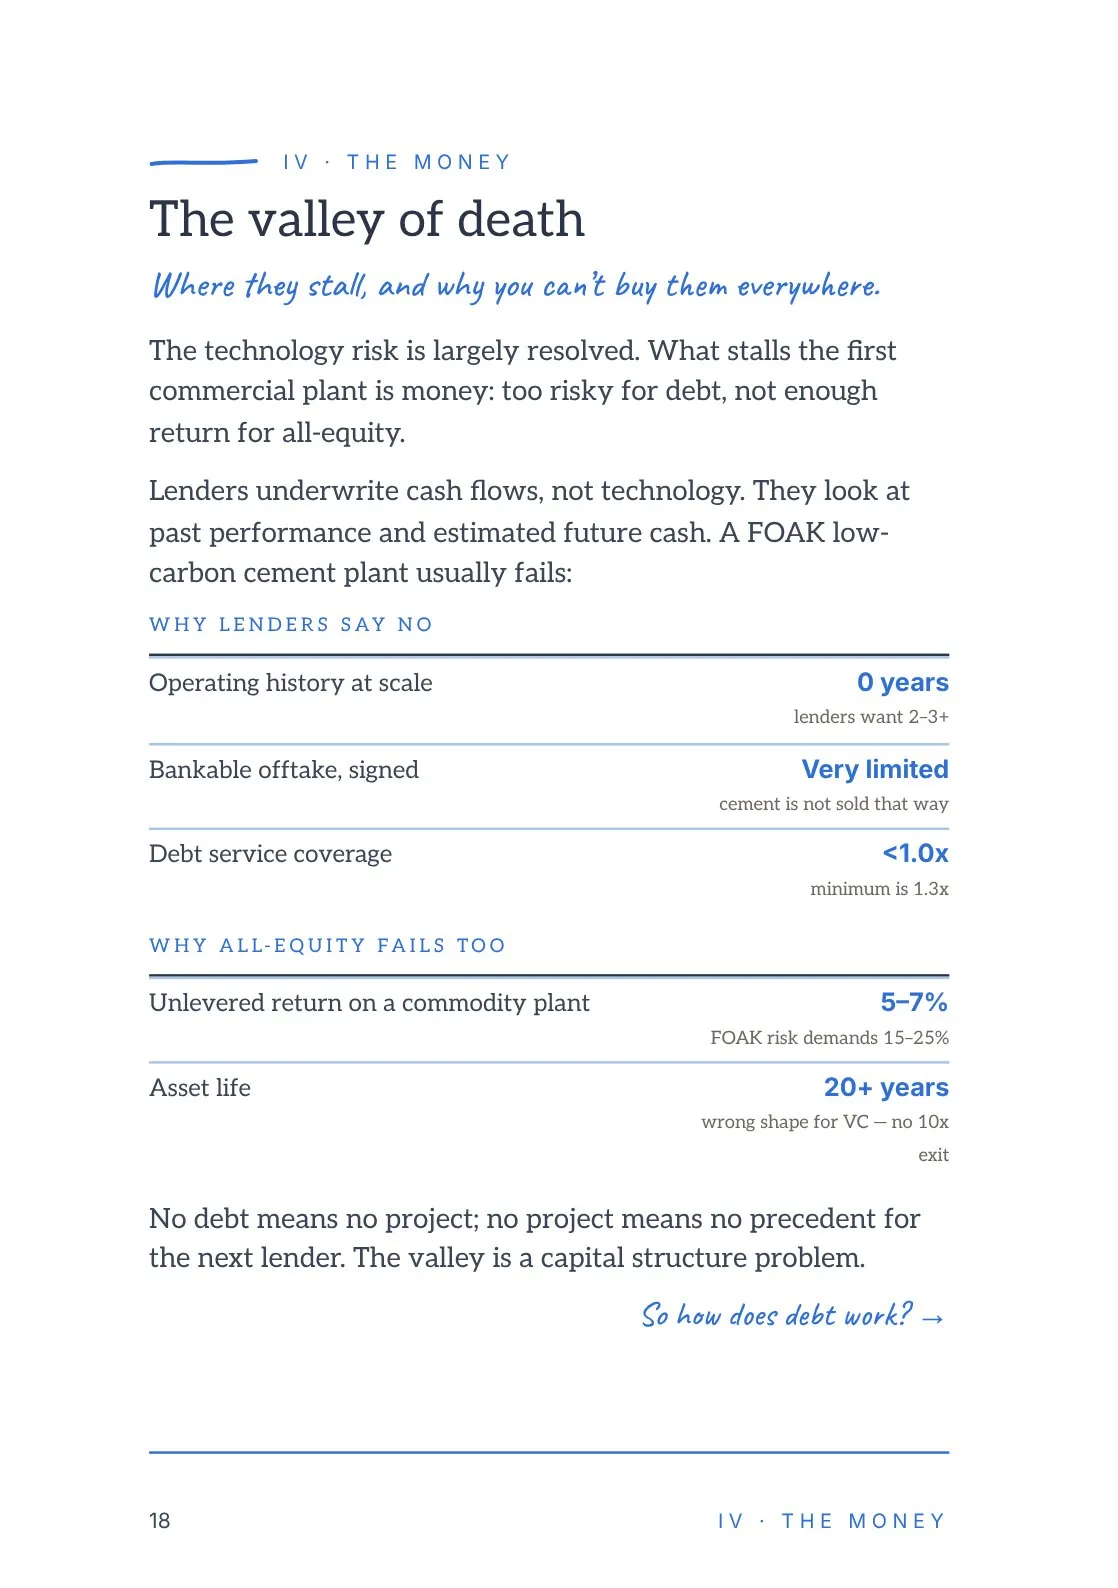
The technology risk is largely resolved. What stalls the first commercial plant is money: too risky for debt, not enough return for all-equity.
Lenders underwrite cash flows, not technology. They look at past performance and estimated future cash. A FOAK low-carbon cement plant usually fails:
Why lenders say no. Operating history at scale: 0 years, where lenders want 2–3+. Bankable offtake, signed: very limited, because cement is not sold that way. Debt service coverage: under 1.0x, where the minimum is 1.3x.
Why all-equity fails too. Unlevered return on a commodity plant: 5–7%, where FOAK risk demands 15–25%. Asset life: 20+ years, the wrong shape for VC — no 10x exit.
No debt means no project; no project means no precedent for the next lender. The valley is a capital structure problem.
So how does debt work?
Page 19How debt works
Start on the lender’s side of the table.
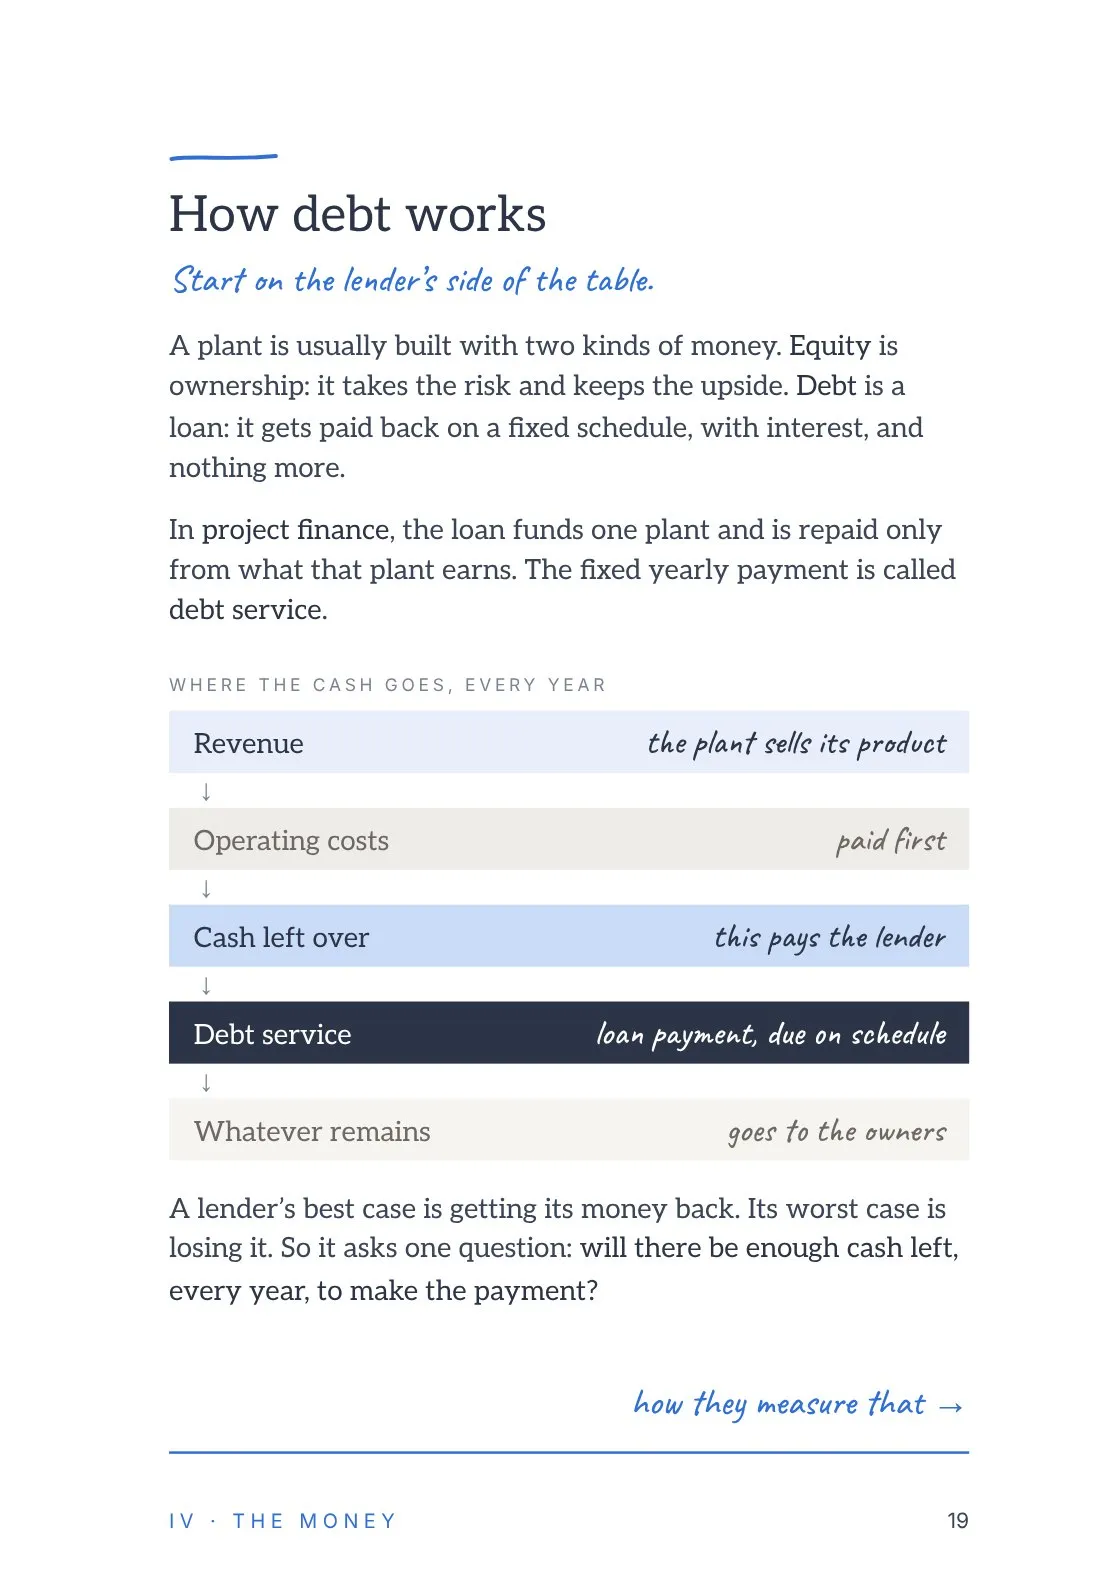
A plant is usually built with two kinds of money. Equity is ownership: it takes the risk and keeps the upside. Debt is a loan: it gets paid back on a fixed schedule, with interest, and nothing more.
In project finance, the loan funds one plant and is repaid only from what that plant earns. The fixed yearly payment is called debt service.
Where the cash goes, every year: revenue, as the plant sells its product; operating costs, paid first; cash left over, which pays the lender; debt service, the loan payment due on schedule; whatever remains goes to the owners.
A lender’s best case is getting its money back. Its worst case is losing it. So it asks one question: will there be enough cash left, every year, to make the payment?
How they measure that.
Page 20What the DSCR is
One ratio, and how to work it out.
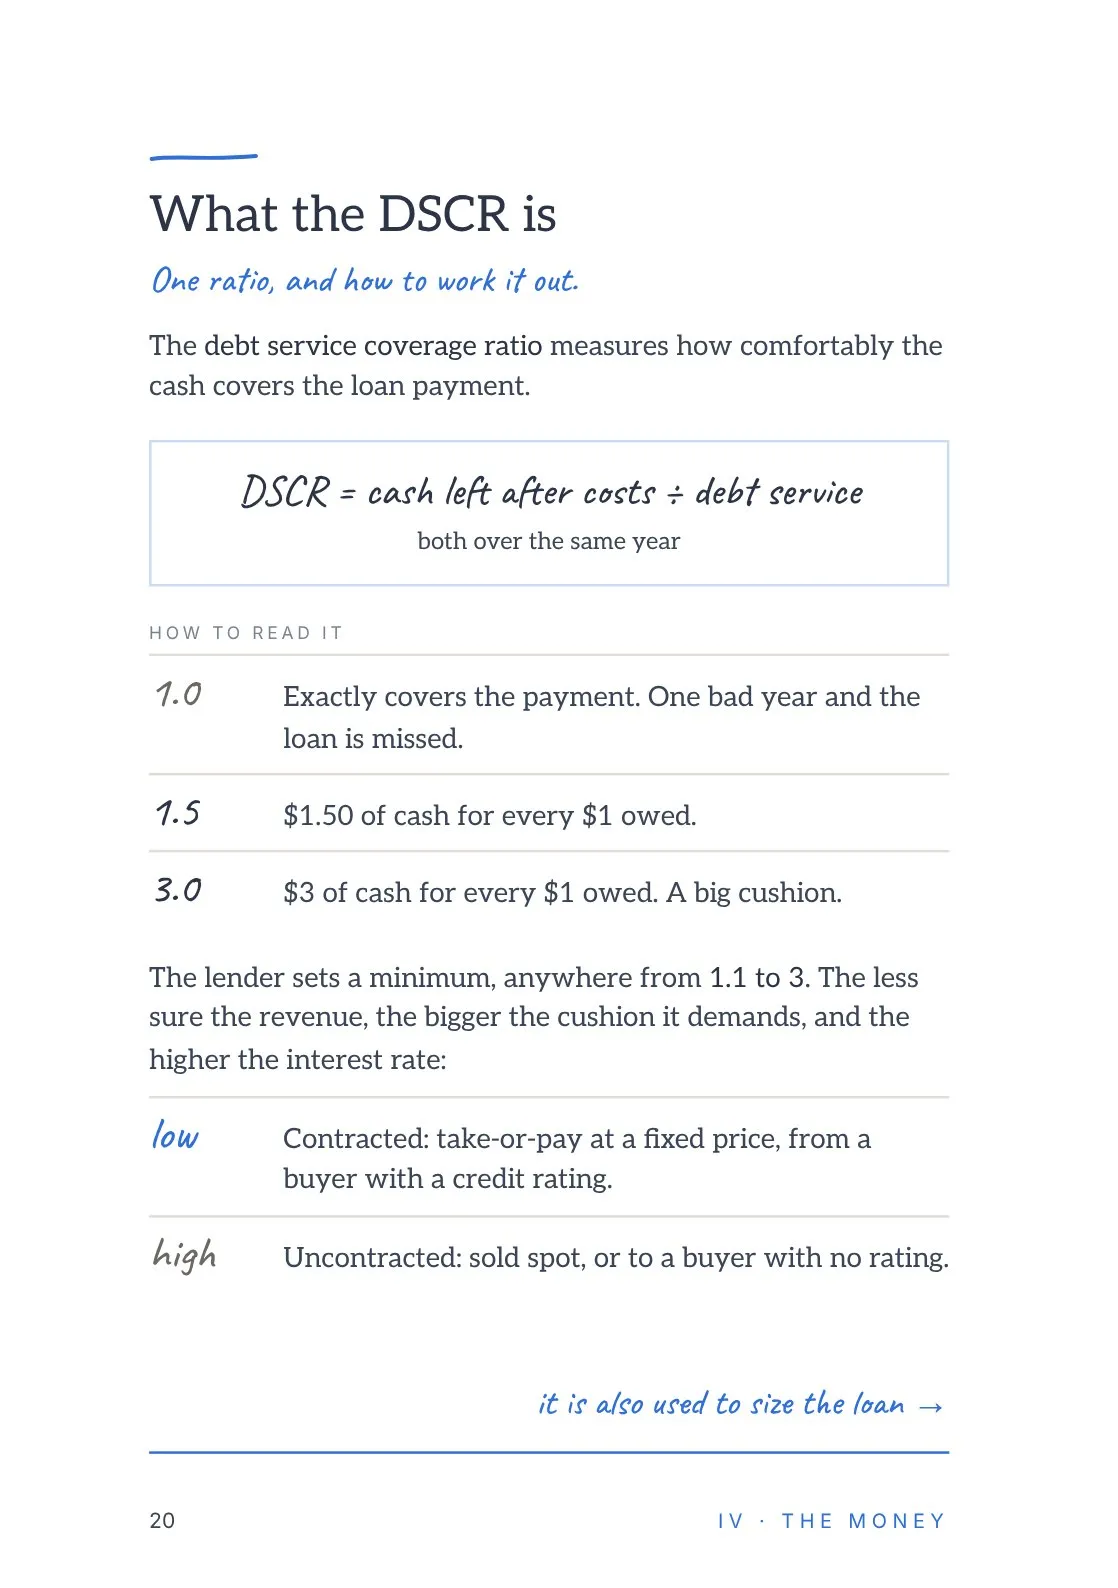
The debt service coverage ratio measures how comfortably the cash covers the loan payment.
DSCR = cash left after costs ÷ debt service, both over the same year.
How to read it. 1.0: exactly covers the payment. One bad year and the loan is missed. 1.5: $1.50 of cash for every $1 owed. 3.0: $3 of cash for every $1 owed. A big cushion.
The lender sets a minimum, anywhere from 1.1 to 3. The less sure the revenue, the bigger the cushion it demands, and the higher the interest rate:
Low: contracted — take-or-pay at a fixed price, from a buyer with a credit rating. High: uncontracted — sold spot, or to a buyer with no rating.
It is also used to size the loan.
Page 21How the DSCR sizes the loan
Same plant, two answers.
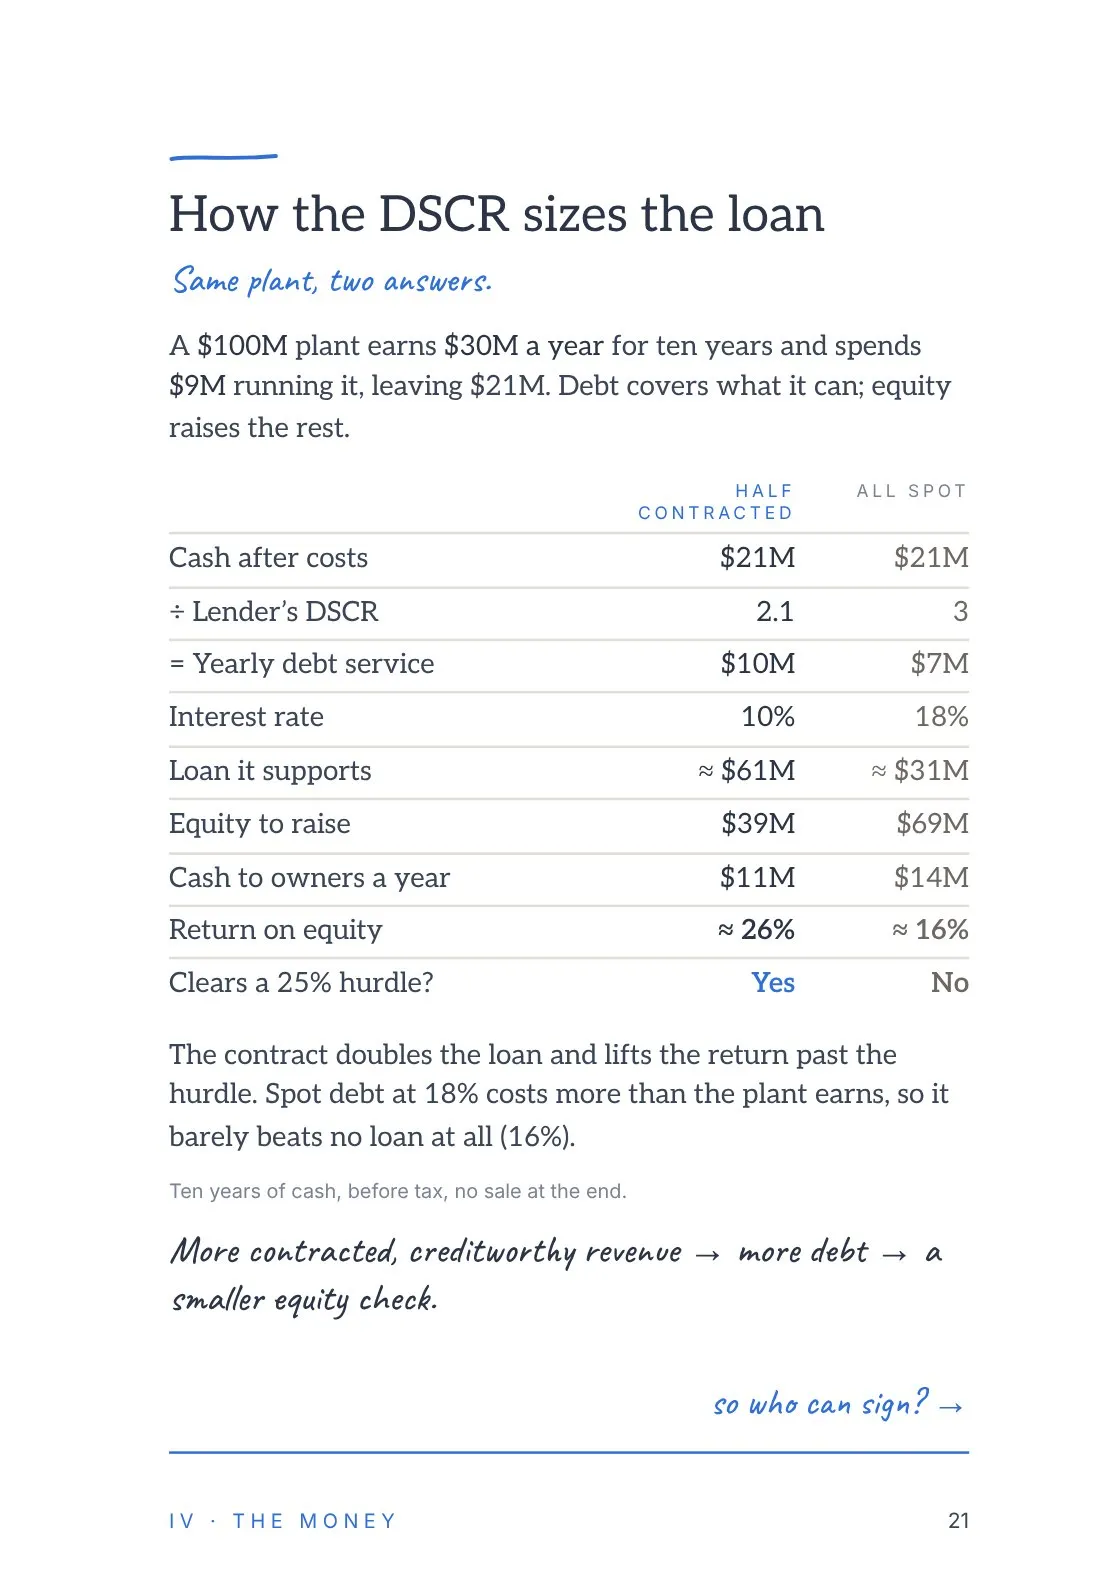
A $100M plant earns $30M a year for ten years and spends $9M running it, leaving $21M. Debt covers what it can; equity raises the rest.
Half contracted: $21M cash after costs, divided by a lender’s DSCR of 2.1, gives $10M of yearly debt service. At 10% interest that supports a loan of about $61M, leaving $39M of equity to raise and $11M a year to owners. Return on equity is about 26%, which clears a 25% hurdle.
All spot: $21M cash after costs, divided by a DSCR of 3, gives $7M of yearly debt service. At 18% interest that supports a loan of about $31M, leaving $69M of equity and $14M a year to owners. Return on equity is about 16%, which does not clear the hurdle.
The contract doubles the loan and lifts the return past the hurdle. Spot debt at 18% costs more than the plant earns, so it barely beats no loan at all (16%).
Ten years of cash, before tax, no sale at the end.
More contracted, creditworthy revenue → more debt → a smaller equity check.
So who can sign?
Page 22Offtake: what we see
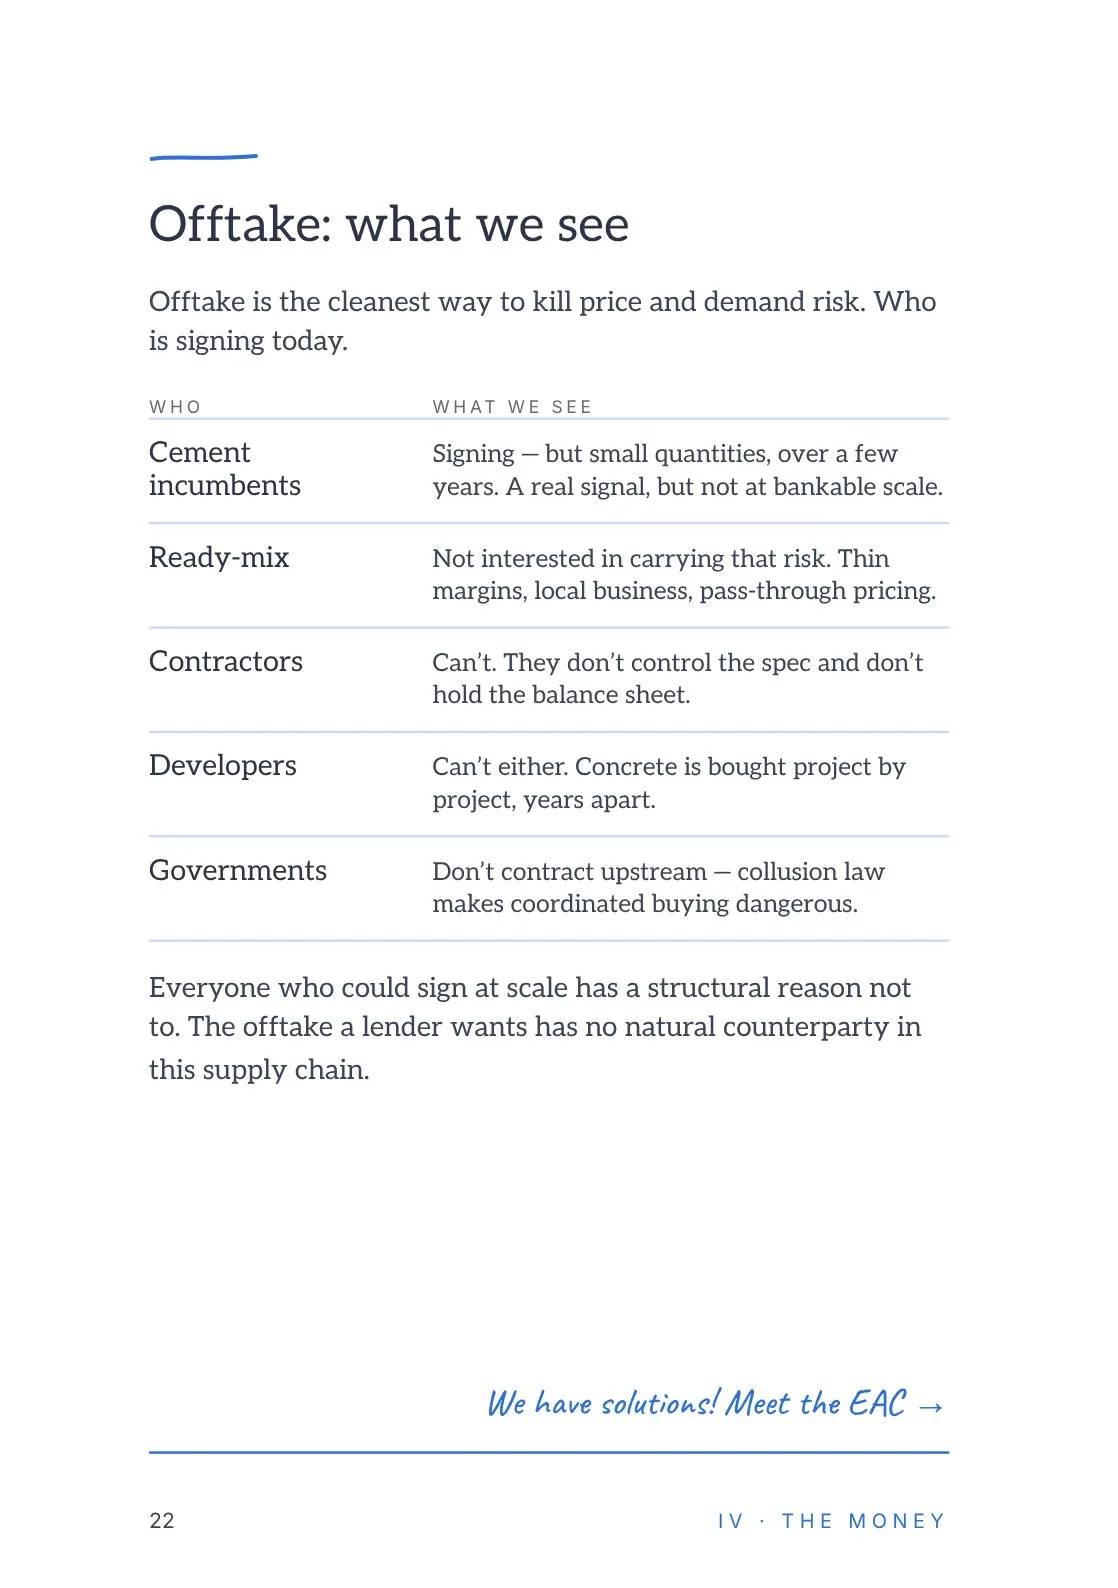
Offtake is the cleanest way to kill price and demand risk. Who is signing today.
Cement incumbents: signing — but small quantities, over a few years. A real signal, but not at bankable scale.
Ready-mix: not interested in carrying that risk. Thin margins, local business, pass-through pricing.
Contractors: can’t. They don’t control the spec and don’t hold the balance sheet.
Developers: can’t either. Concrete is bought project by project, years apart.
Governments: don’t contract upstream — collusion law makes coordinated buying dangerous.
Everyone who could sign at scale has a structural reason not to. The offtake a lender wants has no natural counterparty in this supply chain.
We have solutions! Meet the EAC.
Page 23What an EAC is
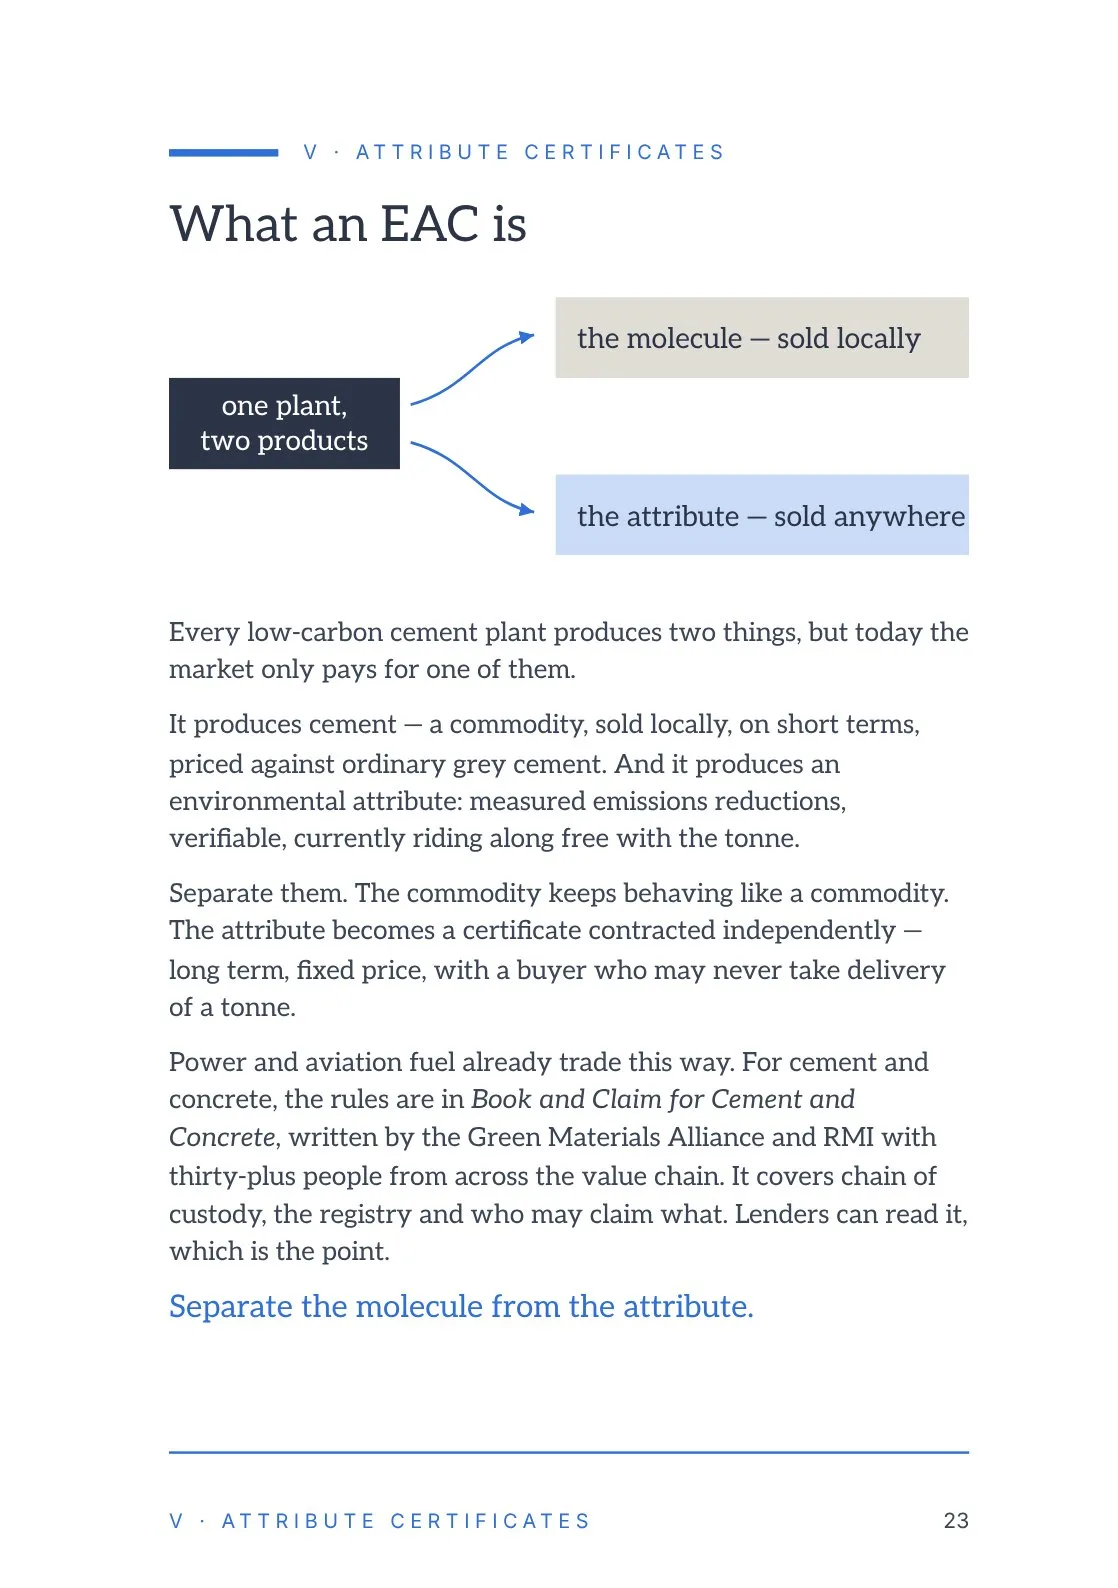
One plant, two products: the molecule, sold locally, and the attribute, sold anywhere.
Every low-carbon cement plant produces two things, but today the market only pays for one of them.
It produces cement — a commodity, sold locally, on short terms, priced against ordinary grey cement. And it produces an environmental attribute: measured emissions reductions, verifiable, currently riding along free with the tonne.
Separate them. The commodity keeps behaving like a commodity. The attribute becomes a certificate contracted independently — long term, fixed price, with a buyer who may never take delivery of a tonne.
Power and aviation fuel already trade this way. For cement and concrete, the rules are in Book and Claim for Cement and Concrete, written by the Green Materials Alliance and RMI with thirty-plus people from across the value chain. It covers chain of custody, the registry and who may claim what. Lenders can read it, which is the point.
Separate the molecule from the attribute.
Page 24Who is going to buy them?
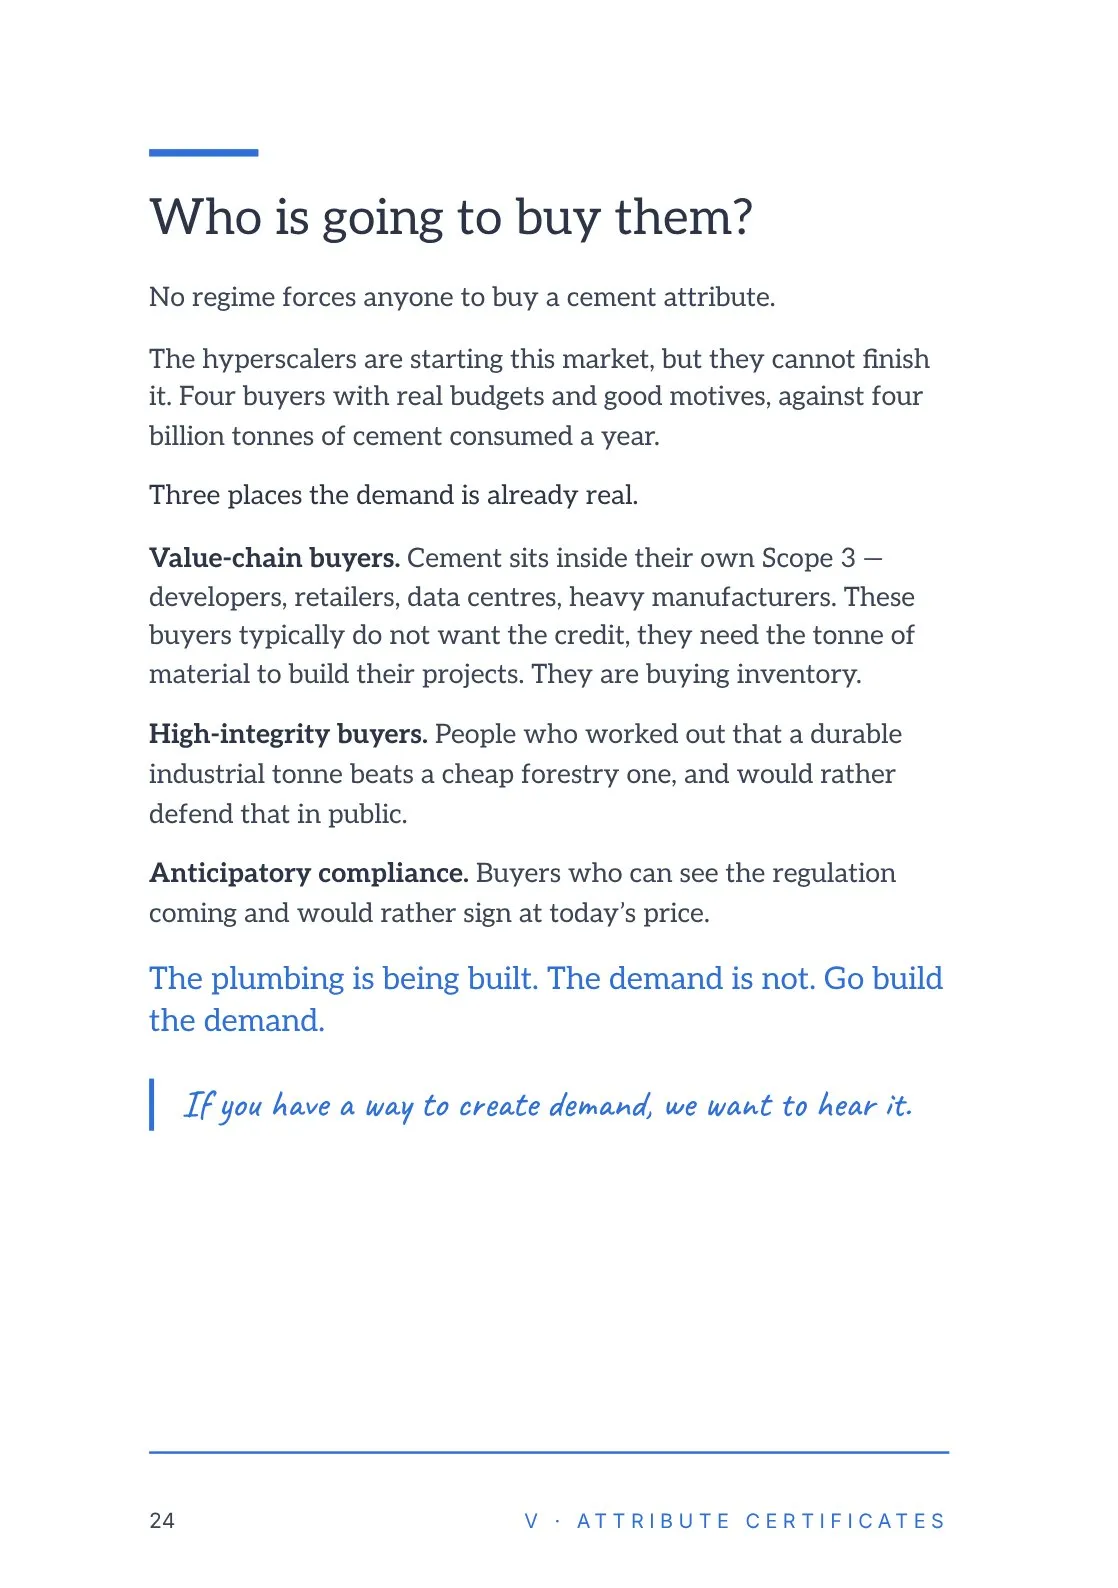
No regime forces anyone to buy a cement attribute.
The hyperscalers are starting this market, but they cannot finish it. Four buyers with real budgets and good motives, against four billion tonnes of cement consumed a year.
Three places the demand is already real.
Value-chain buyers. Cement sits inside their own Scope 3 — developers, retailers, data centres, heavy manufacturers. These buyers typically do not want the credit, they need the tonne of material to build their projects. They are buying inventory.
High-integrity buyers. People who worked out that a durable industrial tonne beats a cheap forestry one, and would rather defend that in public.
Anticipatory compliance. Buyers who can see the regulation coming and would rather sign at today’s price.
The plumbing is being built. The demand is not. Go build the demand.
If you have a way to create demand, we want to hear it.
Page 25Why SBTi does not rescue this
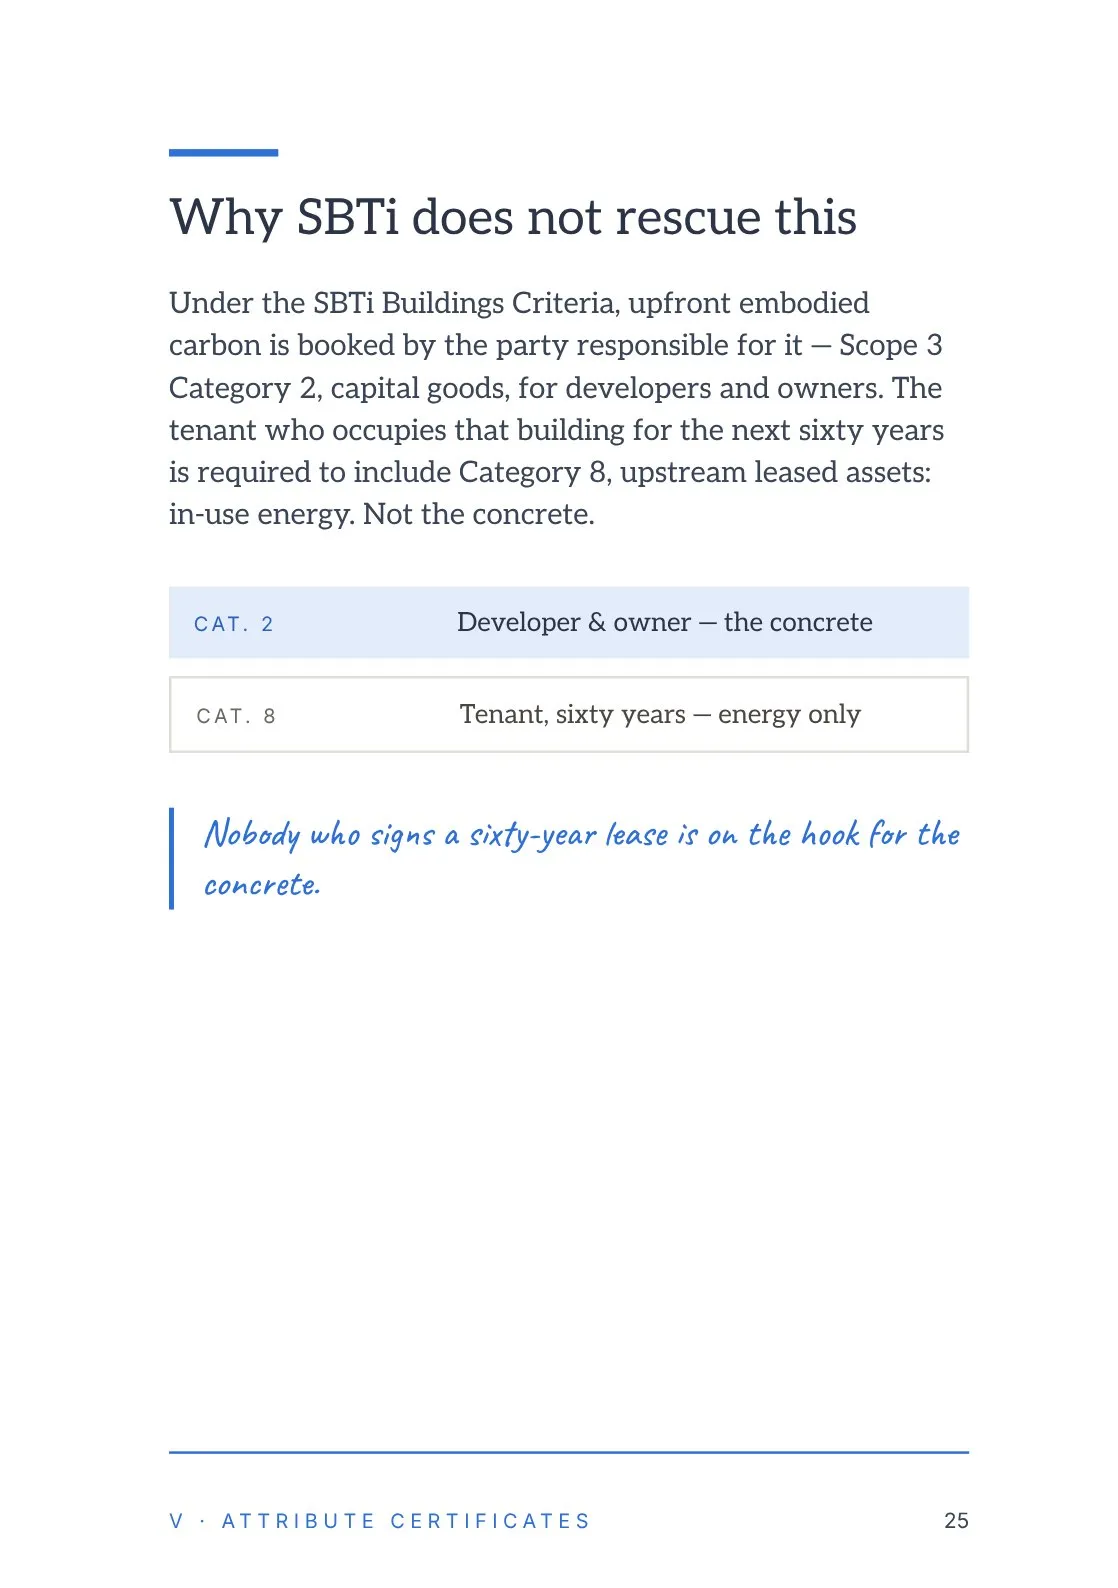
Under the SBTi Buildings Criteria, upfront embodied carbon is booked by the party responsible for it — Scope 3 Category 2, capital goods, for developers and owners. The tenant who occupies that building for the next sixty years is required to include Category 8, upstream leased assets: in-use energy. Not the concrete.
Category 2: developer and owner — the concrete. Category 8: tenant, sixty years — energy only.
Nobody who signs a sixty-year lease is on the hook for the concrete.
Page 26Stacking and EACs
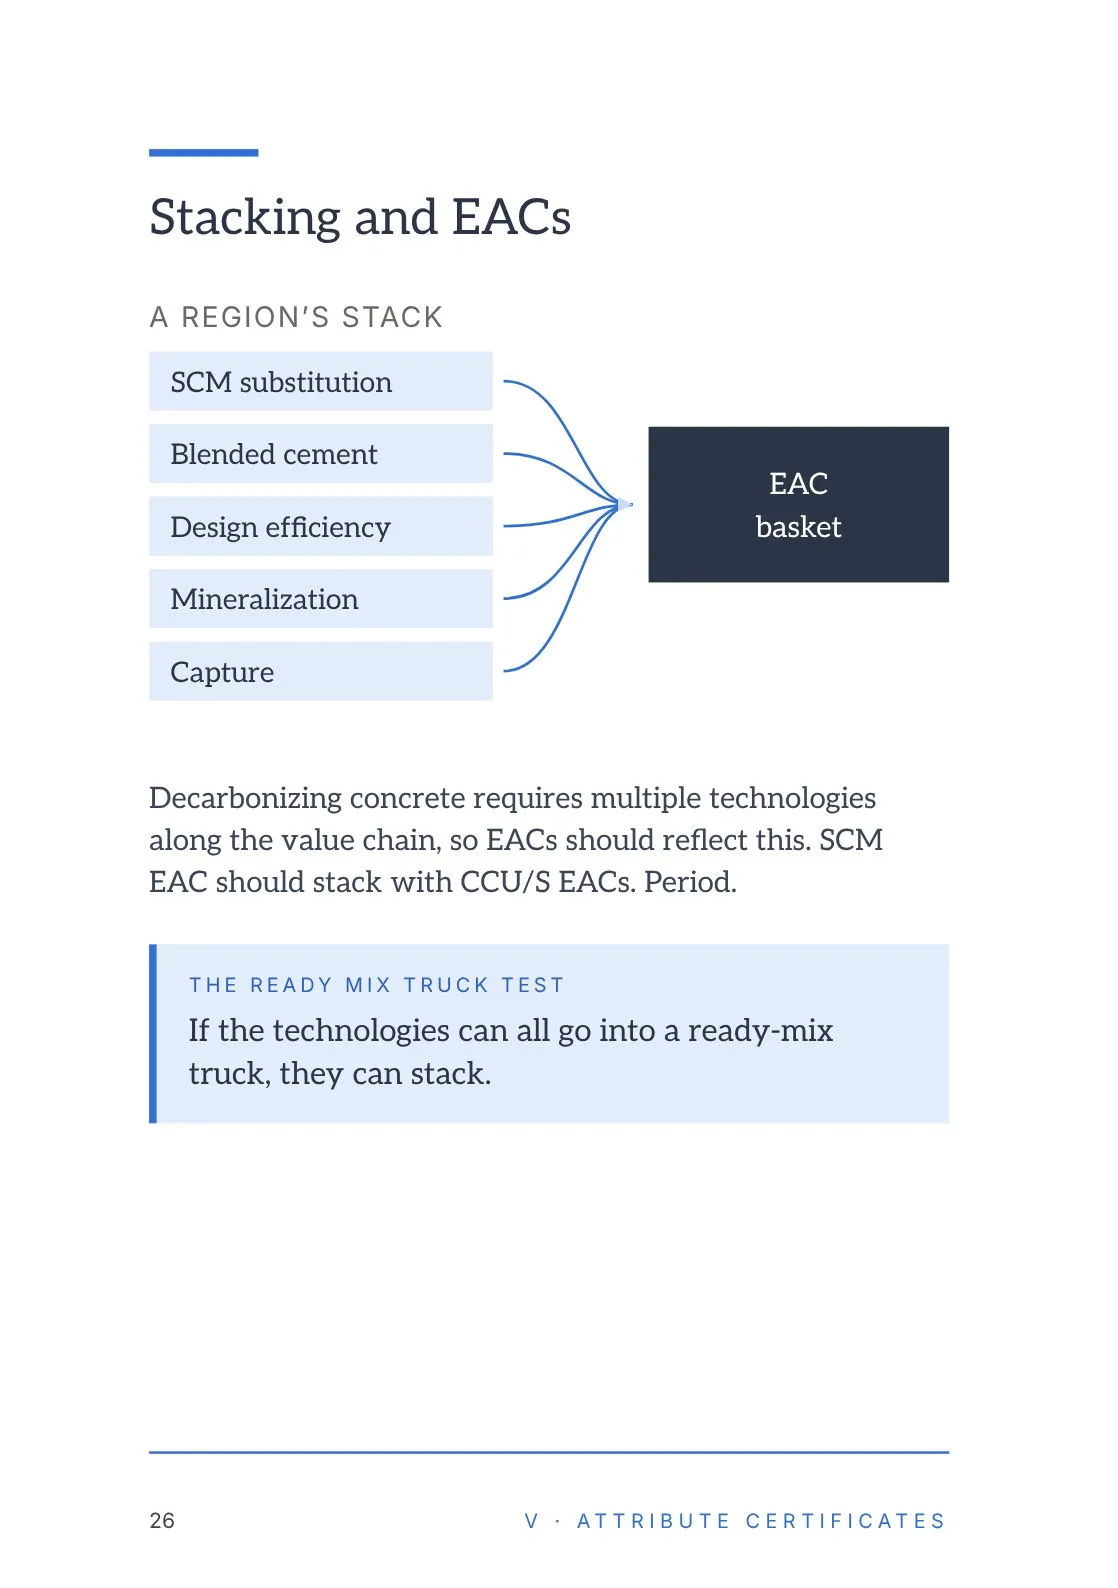
A region’s stack: SCM substitution, blended cement, design efficiency, mineralization and capture, all feeding one EAC basket.
Decarbonizing concrete requires multiple technologies along the value chain, so EACs should reflect this. SCM EAC should stack with CCU/S EACs. Period.
The ready mix truck test: if the technologies can all go into a ready-mix truck, they can stack.
Page 27Blend the EACs under the carbon price
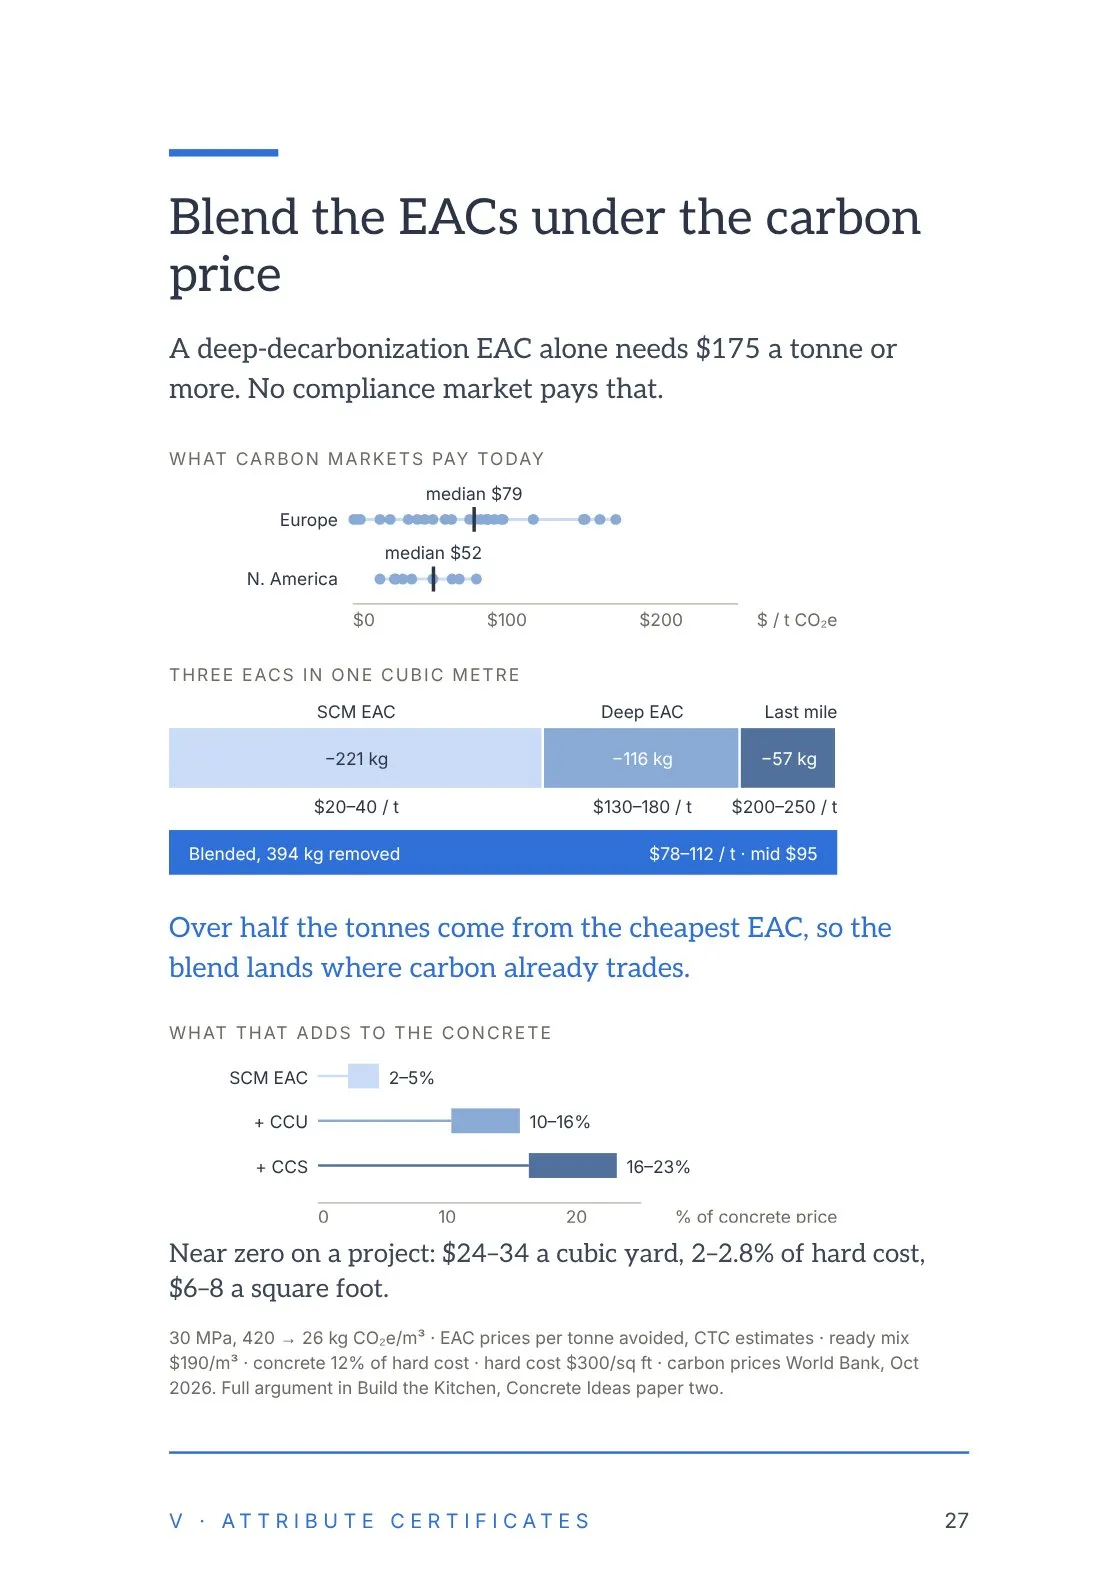
A deep-decarbonization EAC alone needs $175 a tonne or more. No compliance market pays that.
What carbon markets pay today: a median of $79 a tonne CO₂e in Europe and $52 in North America.
Three EACs in one cubic metre: an SCM EAC removing 221 kg at $20–40 a tonne, a deep EAC removing 116 kg at $130–180 a tonne, and a last-mile EAC removing 57 kg at $200–250 a tonne. Blended, 394 kg removed at $78–112 a tonne, mid $95.
Over half the tonnes come from the cheapest EAC, so the blend lands where carbon already trades.
What that adds to the concrete price: 2–5% for the SCM EAC, 10–16% adding CCU, 16–23% adding CCS.
Near zero on a project: $24–34 a cubic yard, 2–2.8% of hard cost, $6–8 a square foot.
30 MPa, 420 → 26 kg CO₂e/m³ · EAC prices per tonne avoided, CTC estimates · ready mix $190/m³ · concrete 12% of hard cost · hard cost $300/sq ft · carbon prices World Bank, Oct 2026. Full argument in Build the Kitchen, Concrete Ideas paper two.
Page 28Glossary
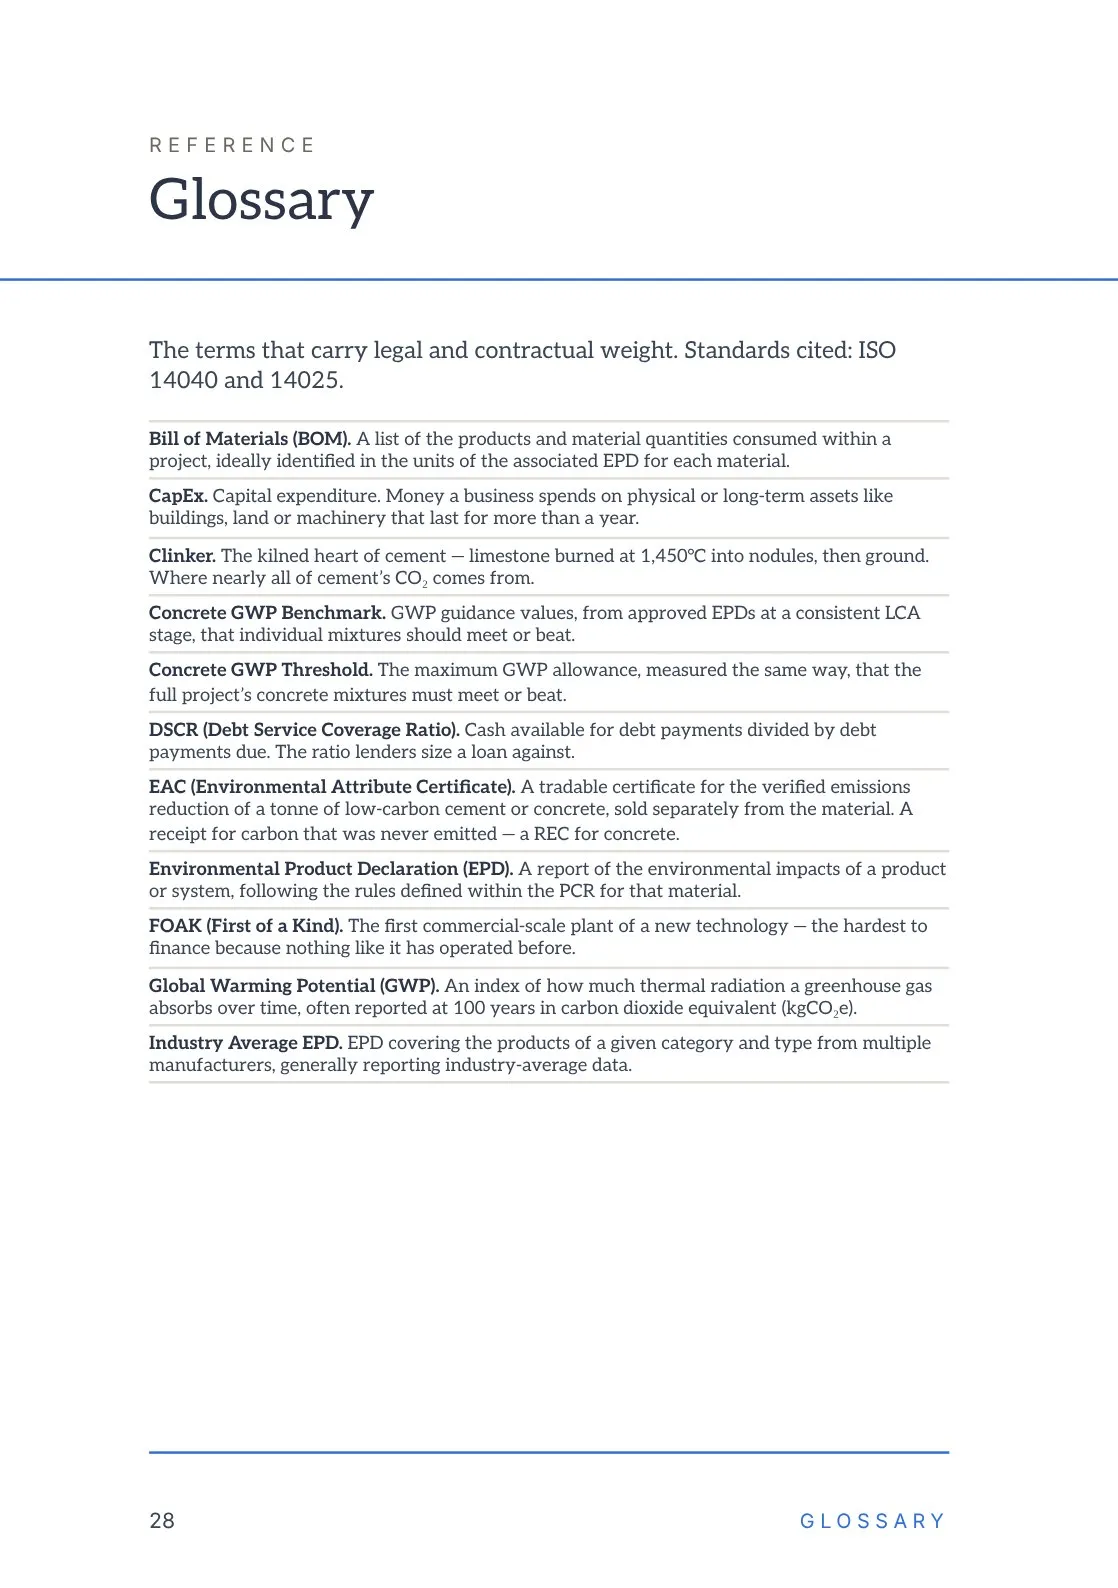
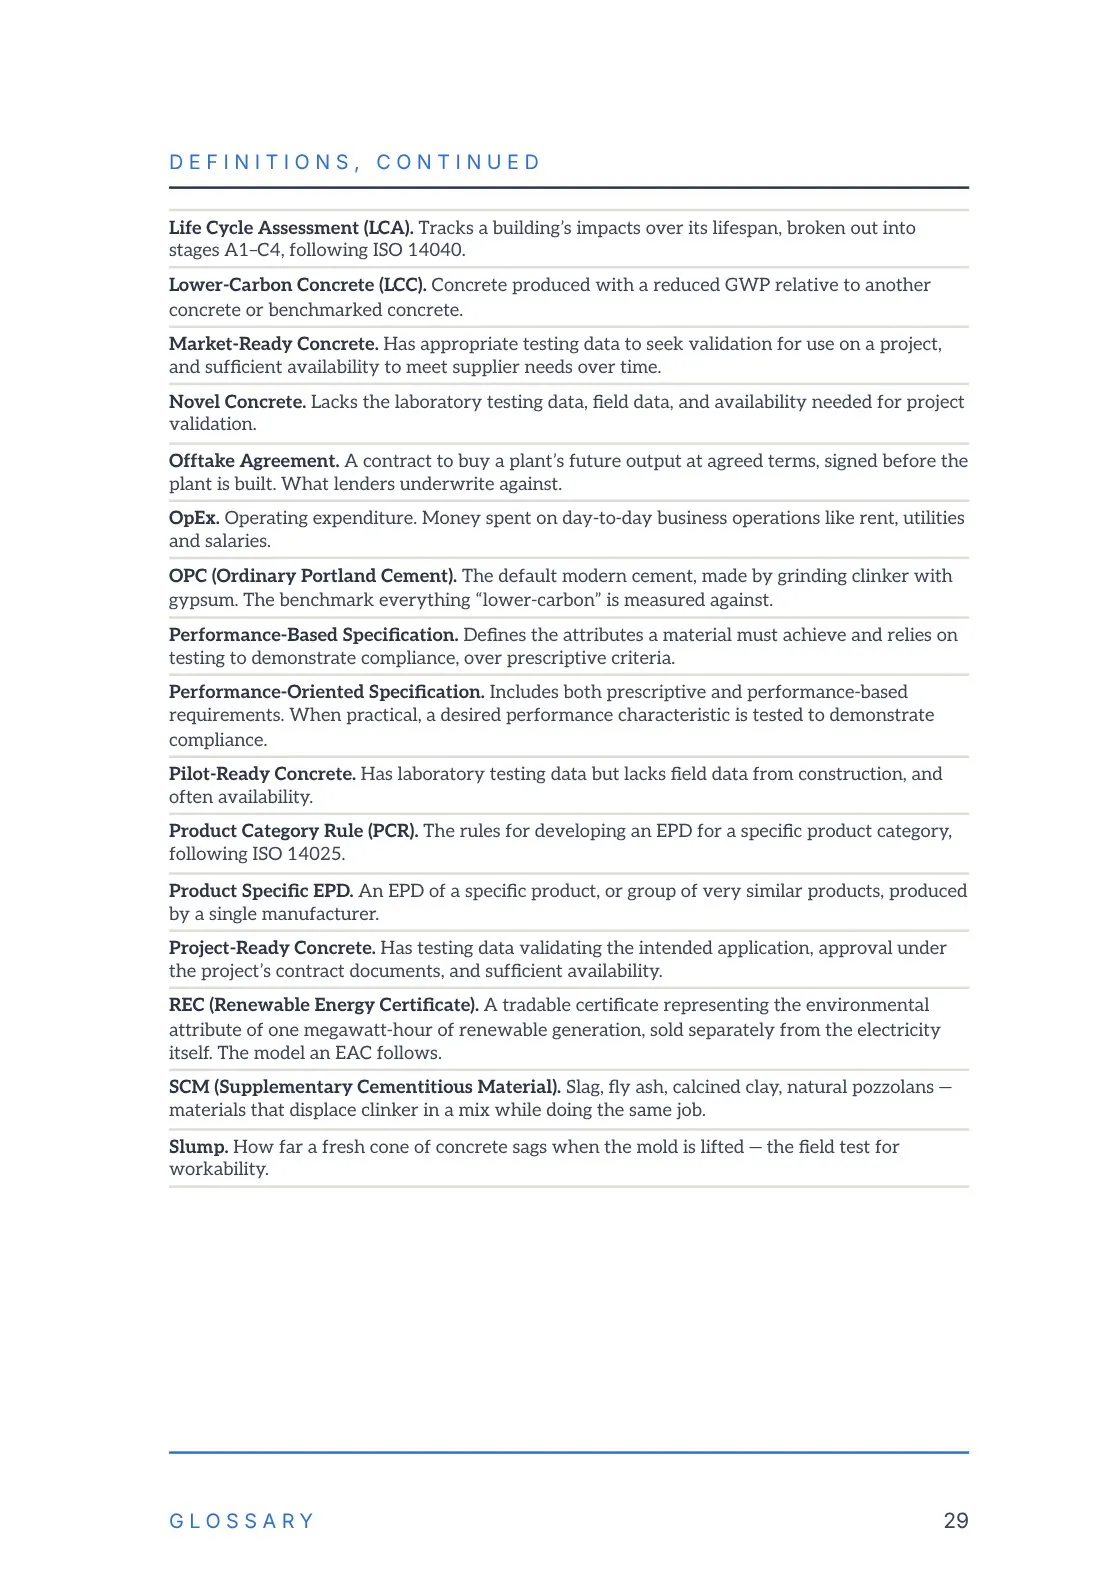
The terms that carry legal and contractual weight. Standards cited: ISO 14040 and 14025.
Bill of Materials (BOM). A list of the products and material quantities consumed within a project, ideally identified in the units of the associated EPD for each material.
CapEx. Capital expenditure. Money a business spends on physical or long-term assets like buildings, land or machinery that last for more than a year.
Clinker. The kilned heart of cement — limestone burned at 1,450°C into nodules, then ground. Where nearly all of cement’s CO₂ comes from.
Concrete GWP Benchmark. GWP guidance values, from approved EPDs at a consistent LCA stage, that individual mixtures should meet or beat.
Concrete GWP Threshold. The maximum GWP allowance, measured the same way, that the full project’s concrete mixtures must meet or beat.
DSCR (Debt Service Coverage Ratio). Cash available for debt payments divided by debt payments due. The ratio lenders size a loan against.
EAC (Environmental Attribute Certificate). A tradable certificate for the verified emissions reduction of a tonne of low-carbon cement or concrete, sold separately from the material. A receipt for carbon that was never emitted — a REC for concrete.
Environmental Product Declaration (EPD). A report of the environmental impacts of a product or system, following the rules defined within the PCR for that material.
FOAK (First of a Kind). The first commercial-scale plant of a new technology — the hardest to finance because nothing like it has operated before.
Global Warming Potential (GWP). An index of how much thermal radiation a greenhouse gas absorbs over time, often reported at 100 years in carbon dioxide equivalent (kgCO₂e).
Industry Average EPD. EPD covering the products of a given category and type from multiple manufacturers, generally reporting industry-average data.
Page 29
Life Cycle Assessment (LCA). Tracks a building’s impacts over its lifespan, broken out into stages A1–C4, following ISO 14040.
Lower-Carbon Concrete (LCC). Concrete produced with a reduced GWP relative to another concrete or benchmarked concrete.
Market-Ready Concrete. Has appropriate testing data to seek validation for use on a project, and sufficient availability to meet supplier needs over time.
Novel Concrete. Lacks the laboratory testing data, field data, and availability needed for project validation.
Offtake Agreement. A contract to buy a plant’s future output at agreed terms, signed before the plant is built. What lenders underwrite against.
OpEx. Operating expenditure. Money spent on day-to-day business operations like rent, utilities and salaries.
OPC (Ordinary Portland Cement). The default modern cement, made by grinding clinker with gypsum. The benchmark everything “lower-carbon” is measured against.
Performance-Based Specification. Defines the attributes a material must achieve and relies on testing to demonstrate compliance, over prescriptive criteria.
Performance-Oriented Specification. Includes both prescriptive and performance-based requirements. When practical, a desired performance characteristic is tested to demonstrate compliance.
Pilot-Ready Concrete. Has laboratory testing data but lacks field data from construction, and often availability.
Product Category Rule (PCR). The rules for developing an EPD for a specific product category, following ISO 14025.
Product Specific EPD. An EPD of a specific product, or group of very similar products, produced by a single manufacturer.
Project-Ready Concrete. Has testing data validating the intended application, approval under the project’s contract documents, and sufficient availability.
REC (Renewable Energy Certificate). A tradable certificate representing the environmental attribute of one megawatt-hour of renewable generation, sold separately from the electricity itself. The model an EAC follows.
SCM (Supplementary Cementitious Material). Slag, fly ash, calcined clay, natural pozzolans — materials that displace clinker in a mix while doing the same job.
Slump. How far a fresh cone of concrete sags when the mold is lifted — the field test for workability.
Page 30References
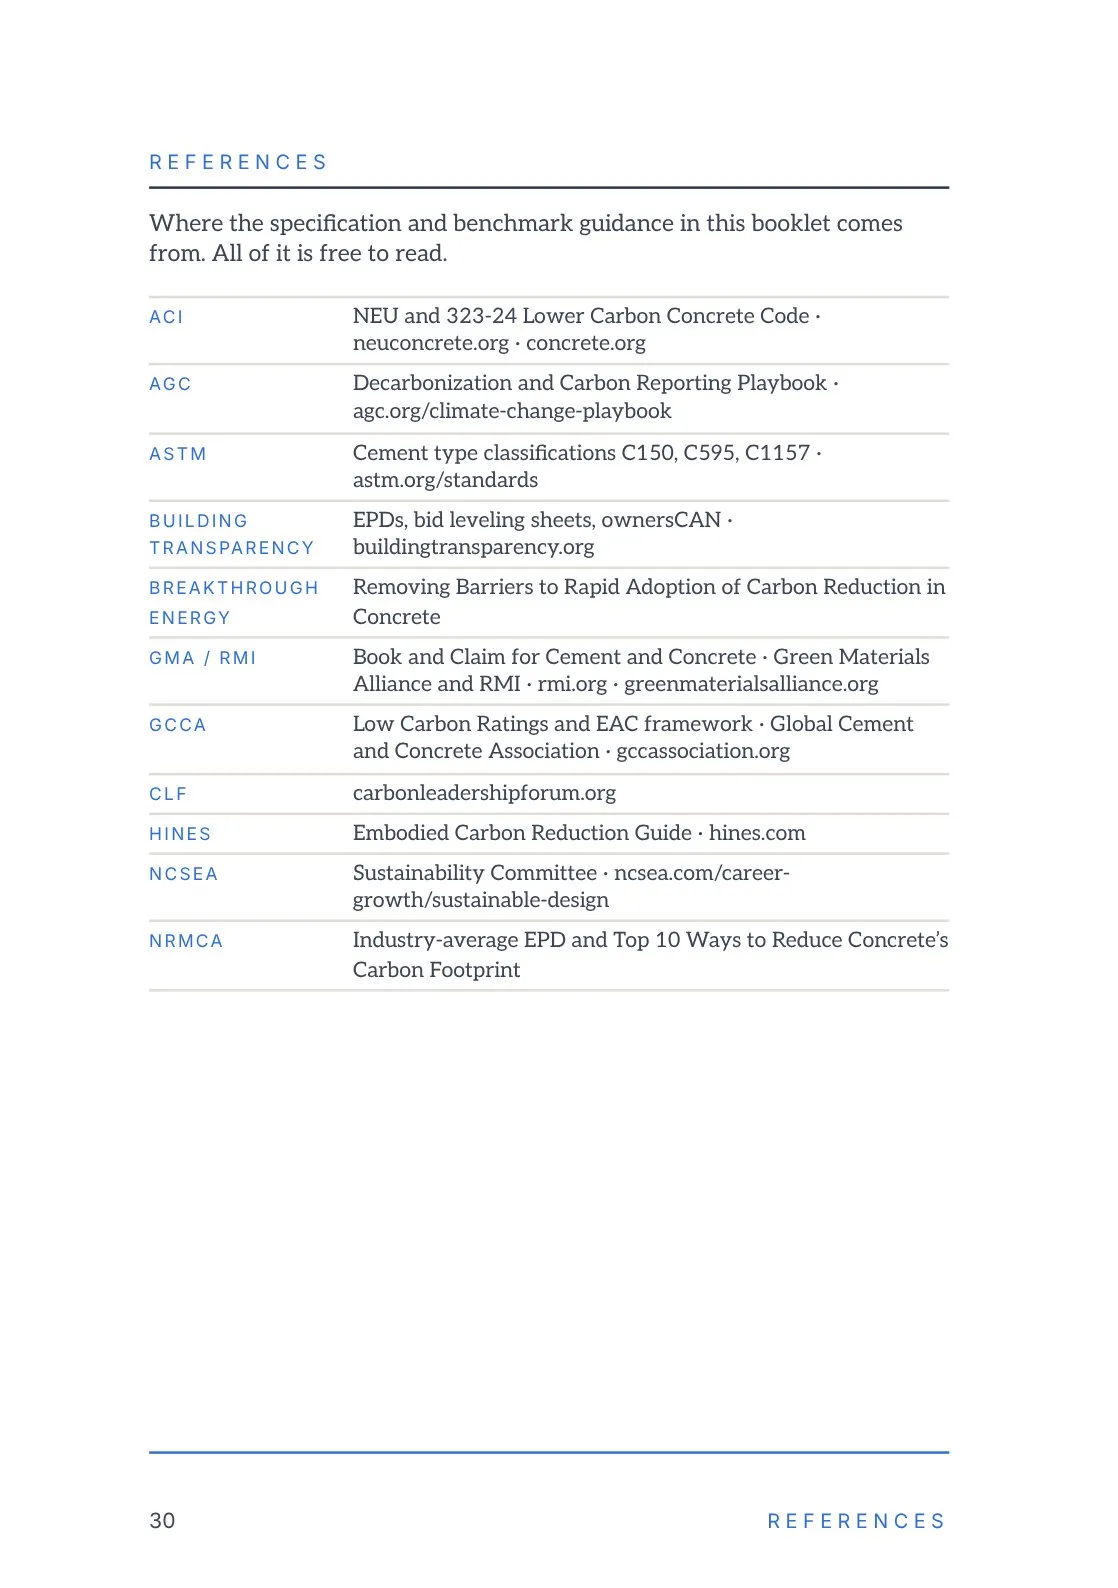
Where the specification and benchmark guidance in this booklet comes from. All of it is free to read.
ACI: NEU and 323-24 Lower Carbon Concrete Code · neuconcrete.org · concrete.org
AGC: Decarbonization and Carbon Reporting Playbook · agc.org/climate-change-playbook
ASTM: cement type classifications C150, C595, C1157 · astm.org/standards
Building Transparency: EPDs, bid leveling sheets, ownersCAN · buildingtransparency.org
Breakthrough Energy: Removing Barriers to Rapid Adoption of Carbon Reduction in Concrete
GMA / RMI: Book and Claim for Cement and Concrete · Green Materials Alliance and RMI · rmi.org · greenmaterialsalliance.org
GCCA: Low Carbon Ratings and EAC framework · Global Cement and Concrete Association · gccassociation.org
CLF: carbonleadershipforum.org
Hines: Embodied Carbon Reduction Guide · hines.com
NCSEA: Sustainability Committee · ncsea.com/career-growth/sustainable-design
NRMCA: Industry-average EPD and Top 10 Ways to Reduce Concrete’s Carbon Footprint
Page 31About Concrete Transition Capital
A small and mighty team, obsessed with decarbonizing concrete in our lifetime.
Concrete Transition Capital is the first dedicated investment platform focused on decarbonizing cement and concrete — the most used man-made material on Earth and one of the largest sources of industrial emissions at 8% of global CO₂. We crowd in market-rate capital by pricing the green premium, applying soft capital where needed, and structuring deals that get plants built. We partner with corporates seeking cleaner materials, philanthropists looking to stretch their climate dollars, and institutional investors who want real returns in the low-carbon transition.
We invest in first-of-a-kind commercial facilities across the value chain — novel chemistries, SCMs, circular materials, plant retrofits, next-gen binders — screened for functionality, scalability, price parity, and carbon performance. And we run the Concrete Terminal, the digital twin of the cement and concrete market.
The team: Genevieve Sherman · Miles Haladay · François-Jérôme Selosse · Wesley Garner · Jennifer Louie · Don Davies
Page 32Come to the gray side.
Concrete Transition Capital · concretetransition.com